Cycling Watts to Calories Calculator
Convert cycling power into mechanical kilojoules, efficiency-adjusted calories, calories per hour, W/kg, FTP share, MET context, and weekly bike energy.
📌Cycling Power Presets
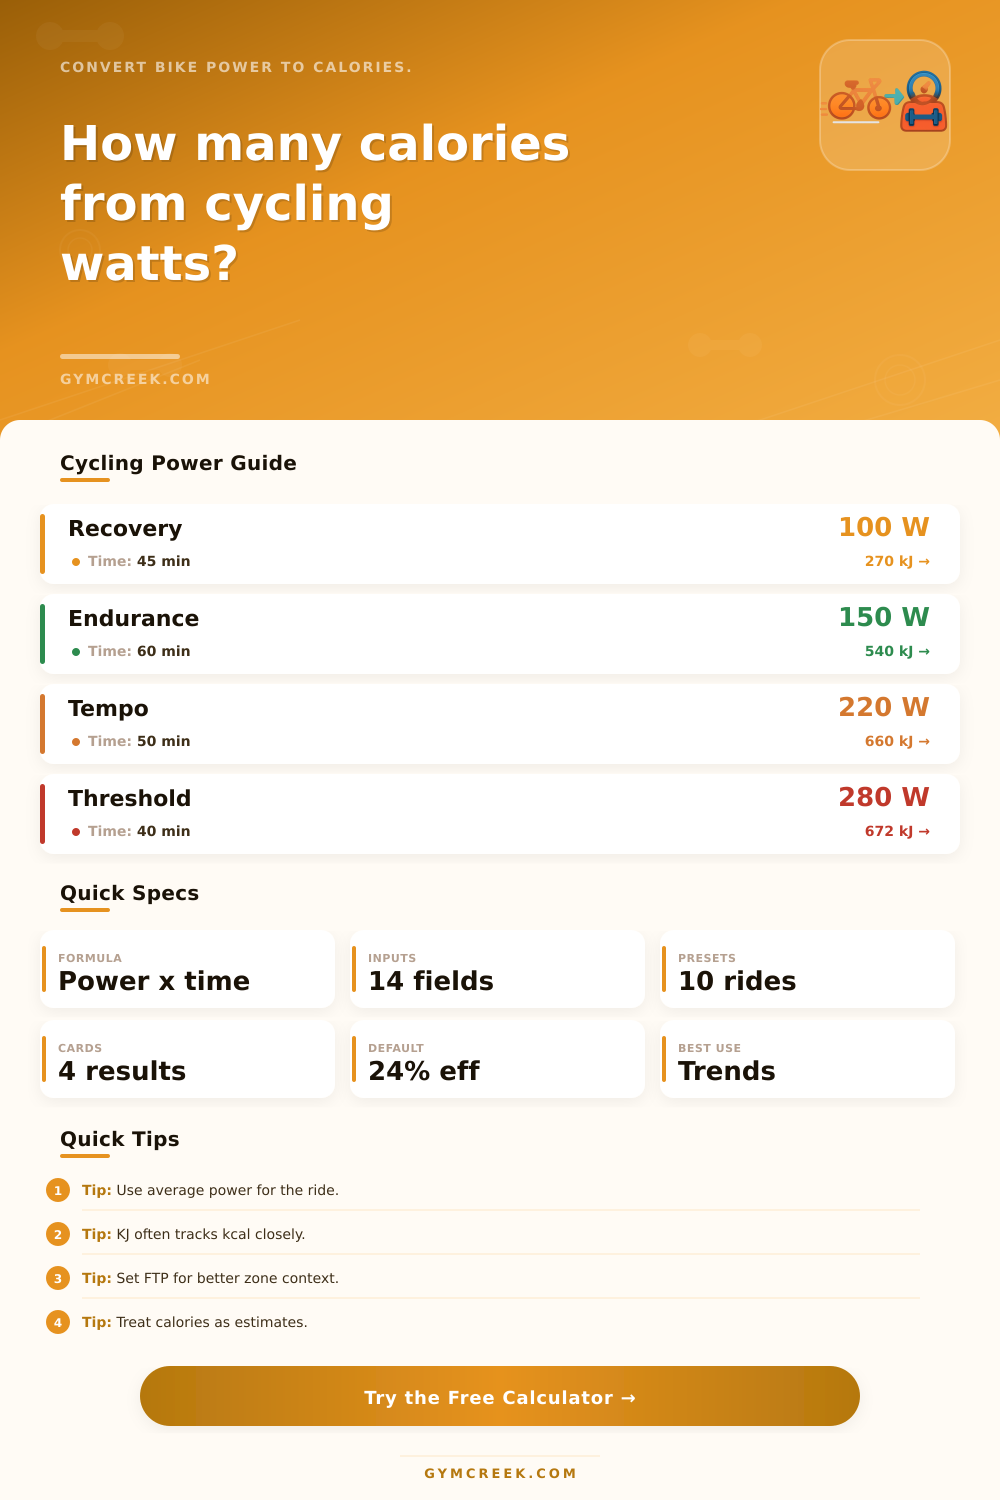
The core calculation is mechanical work from watts and time. Calories are then estimated from gross efficiency, which commonly sits near 20-25% for cycling.
⚙Power and Rider Inputs
Calories from cycling watts
Enter power and duration to calculate cycling calories.
📊Cycling Metrics Grid
📑Reference Tables
| Efficiency | Kcal per kJ | Typical use | Notes |
|---|---|---|---|
| 20% | 1.20 | Conservative high kcal | Lower economy estimate |
| 22% | 1.09 | Common estimate | Many riders fit here |
| 23.9% | 1.00 | kJ equals kcal rule | Popular cycling shortcut |
| 25% | 0.96 | Efficient rider | Lower kcal for same watts |
| Zone | FTP % | Feel | Typical ride |
|---|---|---|---|
| Recovery | Under 55% | Easy spin | Recovery day |
| Endurance | 56-75% | All-day pace | Base ride |
| Tempo | 76-90% | Firm work | Tempo blocks |
| Threshold | 91-105% | Hard sustained | Test or race effort |
| Scenario | Power | Duration | Planning read |
|---|---|---|---|
| Recovery spin | 80-130 W | 30-60 min | Low load, easy fuel |
| Endurance ride | 130-210 W | 60-180 min | Steady calorie volume |
| Indoor class | 150-240 W | 40-60 min | Check console accuracy |
| Race effort | 230-360 W | 20-90 min | High hourly burn |
| Output | Formula | Inputs | Why it matters |
|---|---|---|---|
| Mechanical kJ | W x sec / 1000 | Watts, time | True bike work |
| Food kcal | kJ / eff / 4.184 | Work, efficiency | Metabolic estimate |
| W/kg | Watts / kg | Power, mass | Rider comparison |
| BMR context | Mifflin-St Jeor | Age, sex, size | Daily comparison |
💡Cycling Calculation Tips
The numbers that cycling power meters deliver represents how much energy your body is using. Most riders ride at a 20-25% efficiency meaning there’s a gap between their food energy and their pedal work, so it isn’t just multiplying watts for calories. It’s those factors that are represented in the calculator’s inputs.
Ride duration determine total mechanical work; average power smoothes out the surges. Gross efficiency convert kilojoules to food calories, little changes can mean big differences on the bottom line. Body weight is needed for the power-to-weight or MET estimates, while FTP puts your effort within training zones instead of leaving it as a raw number.
Understanding Your Cycling Numbers
What do all those numbers mean? That’s up to you. To manage your food intake, use the weekly calorie total as a guide. That number will also help you balance your training load against recovery. If this is a session that fits into your day, it’ll show hourly burn. For planning purposes, a W/kg/FTP shows how the ride relate to your current fitness level, which is more useful for planning then just looking at the number of sessions. Efficiency impact show how conversion affects reference tables, so you know what to look at before planning around it.
But that doesn’t tell the full story. Even if your power are constant, factors like cadence, terrain, and setup off the bike also affect how much energy you expend. Perceived effort increases with a headwind but the watts displayed on your screen don’t change. Motivation and cooling can cause indoor rides to appear different then those outdoors. That’s why the calories is considered an estimate by the calculator.
Don’t obsess on individual rides. Look at trends. Are you getting fitter? You’ll see that in improved power-to-weight and more kilojoules climbed each week, you should of seen it. Not seeing fitness progress? Probably need to work on fueling/recovery. Looking at the math gives you a reliable measure; then look across weeks for the story: How are the numbers moving?