Cycling Kilojoules Calculator
Estimate cycling mechanical work, metabolic calories, power-to-weight, climbing cost, ride intensity, and weekly training load from real bike metrics.
📌Cycling Presets
Presets load realistic cycling sessions. Replace them with your power meter, trainer, or route data for the most useful kJ estimate.
⚙Cycling Inputs
Cycling kilojoule snapshot
Enter ride power and duration to calculate mechanical work.
📊Cycling Metrics Grid
📑Reference Tables
| Output | Formula | Inputs | Use |
|---|---|---|---|
| Mechanical kJ | Watts x seconds / 1000 | Power, time | Core bike work |
| Metabolic kcal | kJ / 4.184 / efficiency | kJ, efficiency | Energy estimate |
| Wheel kJ | kJ x drivetrain factor | Loss percent | Road output context |
| Climbing kJ | mass x gravity x gain / 1000 | Weight, elevation | Potential energy |
| Band | IF range | Typical feel | Common use |
|---|---|---|---|
| Recovery | Under 0.60 | Very easy | Easy spin |
| Endurance | 0.60-0.75 | Steady aerobic | Base rides |
| Tempo | 0.76-0.90 | Firm pressure | Long intervals |
| Threshold | 0.91-1.05 | Hard sustained | FTP work |
| High intensity | Over 1.05 | Very hard | Racing or VO2 |
| Scenario | Power | Duration | Expected kJ |
|---|---|---|---|
| Easy recovery | 100 W | 45 min | 270 kJ |
| Endurance ride | 175 W | 2 hr | 1260 kJ |
| Tempo workout | 230 W | 90 min | 1242 kJ |
| Hard hour | 280 W | 60 min | 1008 kJ |
| Ride load | KJ per hour | Fuel cue | Calculator read |
|---|---|---|---|
| Light | Under 400 | Water may suffice | Low gap likely |
| Moderate | 400-650 | 30-60 g/hr | Check duration |
| High | 650-900 | 60-90 g/hr | Fuel matters |
| Race load | Over 900 | 90+ g/hr | Practice intake |
💡Cycling Tips
Kilojoules Kilojoules are unit of measurement for mechanical work your legs do while riding. It’s an indication of your training stress and the calories that were demanded during a ride. Cyclists log this information as a gauge of effort. But the true value is in understanding what this data tell you about your nutrition and recovery needs.
Does your fuel plan align with the work you did? The formula involve two variables: power and time. Mechanical kilojoules are simply average watts times seconds divided by a thousand. But that’s just the raw number, your body isn’t 100 percent efficient. To account for this, gross efficiency calculate the difference between raw numbers and real-world metabolic cost.
What Kilojoules Tell You About Your Ride
The calculator take these inputs and outputs an adjusted value that reflects how much energy is actualy being burned during your workout. It also factor in drivetrain loss. Not all the power generated at the pedals makes it onto the road. Those minor tweaks adds up when you compare indoor sessions to outdoor rides with wind and rolling resistance.
Climbing also add an energy demand to the equation. The amount of weight (or you and your bike) lifted over a hill is its elevation gain. Pure power numbers does not account for this potential energy required to move your body and bike uphill. Riders who live in hilly areas will notice this quickly; they might maintain a steady wattage but still find the ride difficult on certain days. The same ride with climbs will yield fewer kilojoules then a ride at a lower elevation on flatter terrain.
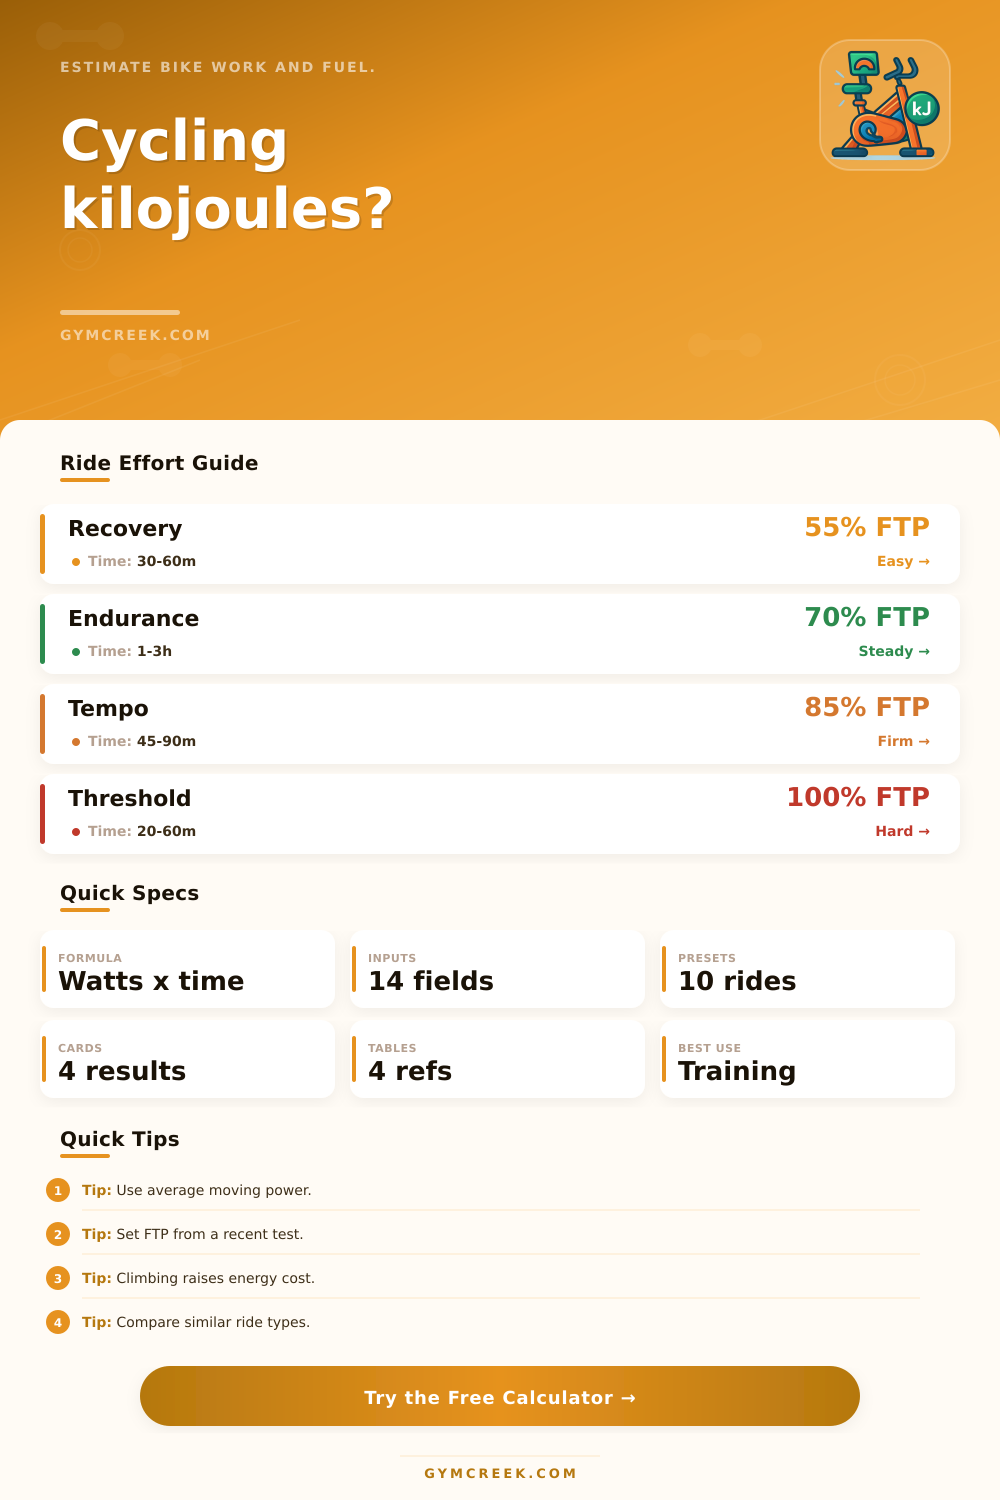
Intensity includes the duration of the ride and your functional threshold power (FTP). The intensity factor is the ratio of average power divided by FTP which will put the ride into one of the zones. Threshold intervals push up towards or beyond the threshold while recovery spins remains far below. Training stress score multiply hours by the square of the intensity factor. That results in a single number representing your cumulative fatigue throughout the week.
Look at this number and your total kilojoules for the week to know when you should of let yourself rest before performance suffers. Those numbers also feed into fueling choices. Your carbohydrate requirements matches your overall calorie needs. Most cyclists plan on getting about 50 percent of their energy from carbohydrates on a long ride. Matching that requirement to your intended fueling makes it easy to see where your plan is lacking. On short rides, carbohydrate requirements are minimal, while hard or long rides deplete glycogen reserves rapidly. The calculator tell you how big that deficit will be so you can close the gap before bonking.
Riders frequently make several errors. They treat kilojoules and calories as if they are the same absolute number. Some use elapsed time instead of moving time, which skews the data. Others do a more accurat job but then look at total energy using moving energy. Because that is an estimate, it should be applied to trends rather than absolute numbers. Context such as cadence, type of ride and the nature of the riding surface can change the perception off the effort. Expect differences, don’t expect perfection.
It’s a simple practical habit. Ride it and log the kilojoules. Match it against other similar rides, make adjustments to your upcoming meals or sessions based off that information. Do this regularly over time, perhaps months, and you can get a better idea of how much any particular ride really costs in terms of kilojoules. This applies whether your training volume is going up, down or sideways. And the quiet single number turns into a good indicator about where you’re headed, and not.