Cycling Gradient Speed Calculator
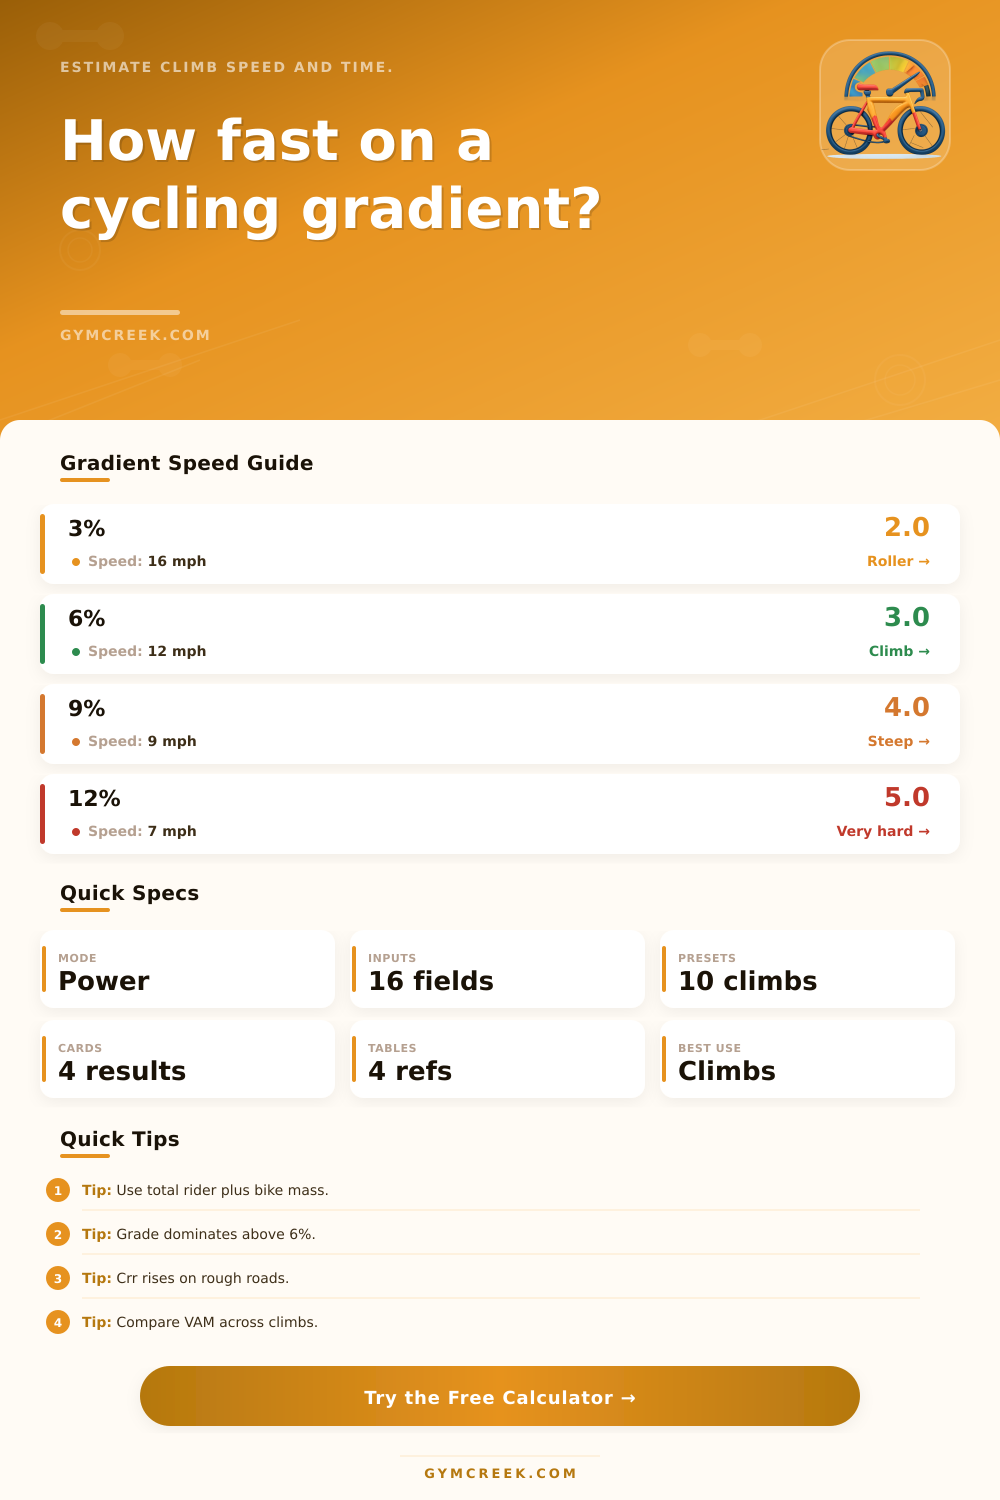
Estimate bike speed on a climb or rolling gradient from power, system weight, grade, route length, wind, surface, aerodynamics, drivetrain loss, and riding position.
📌Gradient Presets
Presets load realistic road and gravel gradient scenarios. Replace them with your route grade, total system weight, and steady climbing power for the best estimate.
⚙Gradient and Rider Inputs
Estimated cycling gradient speed
Enter your climb details to estimate steady-state speed, time, VAM, and power split.
📊Gradient Metrics
📑Reference Tables
| Power term | Formula idea | Main inputs | Climb impact |
|---|---|---|---|
| Gravity | mass x gravity x speed x slope | weight, grade | Dominant on steep climbs |
| Rolling | mass x gravity x Crr x speed | surface, tire | Important on rough roads |
| Aero | 0.5 x rho x CdA x airspeed cubed | position, wind | Grows fast with speed |
| Drivetrain | input power x loss percent | chain, gears | Reduces road power |
| Grade | Typical cue | Primary limiter | Pacing note |
|---|---|---|---|
| 1-3% | False flat | Aero and rolling | Stay smooth and aero |
| 4-6% | Manageable climb | Weight and power | Hold steady torque |
| 7-10% | Real climb | W/kg | Watch surges early |
| 11%+ | Very steep | Gearing and mass | Cadence can fall fast |
| Surface | Typical Crr | Speed effect | Use case |
|---|---|---|---|
| Fast road | 0.0035 | Lowest loss | Race tire, smooth road |
| Endurance road | 0.0050 | Moderate loss | Daily road setup |
| Rough road | 0.0070 | Noticeable loss | Chipseal, bad pavement |
| Gravel | 0.010-0.016 | Large loss | Mixed or loose surface |
| Scenario | Grade | Power cue | Speed cue |
|---|---|---|---|
| False-flat TT | 2-3% | Aero matters | Fast but costly |
| Club climb | 5-7% | Tempo to threshold | Good W/kg test |
| Steep wall | 10-14% | Low cadence risk | Slow and spiky |
| Gravel ramp | 6-10% | Crr matters | Lower than road |
💡Gradient Speed Tips
The steady pitch of a grade change your experience, both in terms of effort required and output of machine. The flats might allow you to cruise along at 22 mph, yet turn up the road and you’re grinding away single digit speed. It’s not that you’ve suddenly become unfit. Instead, gravity will pull back against you more as the incline increases, and your remaining power must deals with rolling resistance and aerodynamic drag. A half pound gained (or lost) or a slight shift in body position matter less a mile before then it does on a hill.
By inputting a rider’s mass, bike weight, sustainable power output and the actual grade, the calculator (above) do the rest of the physics. It will tell you if the climb is in your endurance zone or pushing into your threshold zones. And it will tell you roughly how long it ought to take at that power. Adjusting body position, tire choice, wind, etc., tweak the calculation from ideal conditions to real-world conditions. The tool can even solves for constant speed by taking into account not only gravity, but also air resistance and rolling losses. That means no more guess work as to what might be limiting your progression on any particular slope.
How to Use the Cycling Calculator
The change kicks in for most at about six percent. Before then, tire choice and other aerodynamics makes significant difference in speed. You can save minutes across a long false flat by using faster-rolling tires or by staying lower on the handlebars. Beyond seven or eight percent, it becomes all about overall system weight and wattage per kilo (pounds) sustained. This is where the calculator reveal this trade off: How many watts are lost to moving the bike vs. Is it fighting against its own resistance or drag? It’s that split that helps understand why carrying a water bottle seems insignificant on a three percent incline while suddenly being costly on a twelve percent wall.
Those speed metrics convert into useful time when paired with segment length and elevation gain. That distance lets you figure out how much power you need to maintain for that length of time. The known elevation eliminate having to guess at gain based off grade alone. It will even spit out your vertical ascent per hour which provides a common measure for comparing ascents of varying averages and lengths. One route may have the same total elevation but spread across double the distance. Those two routes could feel totally different, those differences come to the surface without any extra work to convert them manually.
With any grade other than a gentle roller, it turns out that the surface you’re riding on make a bigger difference then expected. When power remains steady but the surface is loose gravel or wet chipseal, the rolling resistance increase just enough to slow down noticeabley. And if you’re on an effort long enough, it compound. The calculator uses a base-level number for various surfaces and lets you fine-tune that. So a rider can dial in his or her performance with a given tire on a particular surface and then see how much a rougher road or softer tire change the outcome before he commits to a course. This would of been particularly helpful for gravel races, where you might go up a similar gradient, but end up with a very different time based off what your wheels are turning over.
Wind adds another layer that changes with speed. Above a certain point, speed increase headwind costs; at the top of a steep grade, however, the bike is traveling so slowly that air resistance represents a diminishing fraction of the overall demand. Even a gentle breeze affects pace decisions when negotiating false flats or rolling terrain preceding a climb, hence its inclusion in the calculation. That same dynamic between position and wind interact: A lower, narrower body position decreases frontal area against which the wind must exert force.
The practical takeaway is that gradient speed isn’t just one thing. It’s derived from the interaction between air, surface, mass, and power, which alters with changing slope. So play around with the various combinations in the calculator ahead of time so you have some idea what is realistic for you on each stretch. Don’t fall into the trap of thinking you’ll be able to go at the same speed uphill as you do on flats. And the numbers lets you get a better sense of what is realistically achievable on any section. It is the difference between going for it and having a plan.