Critical Power Calculator Running
Estimate running critical speed, critical power, D-prime reserve, and target paces from two hard time trials.
📌Presets
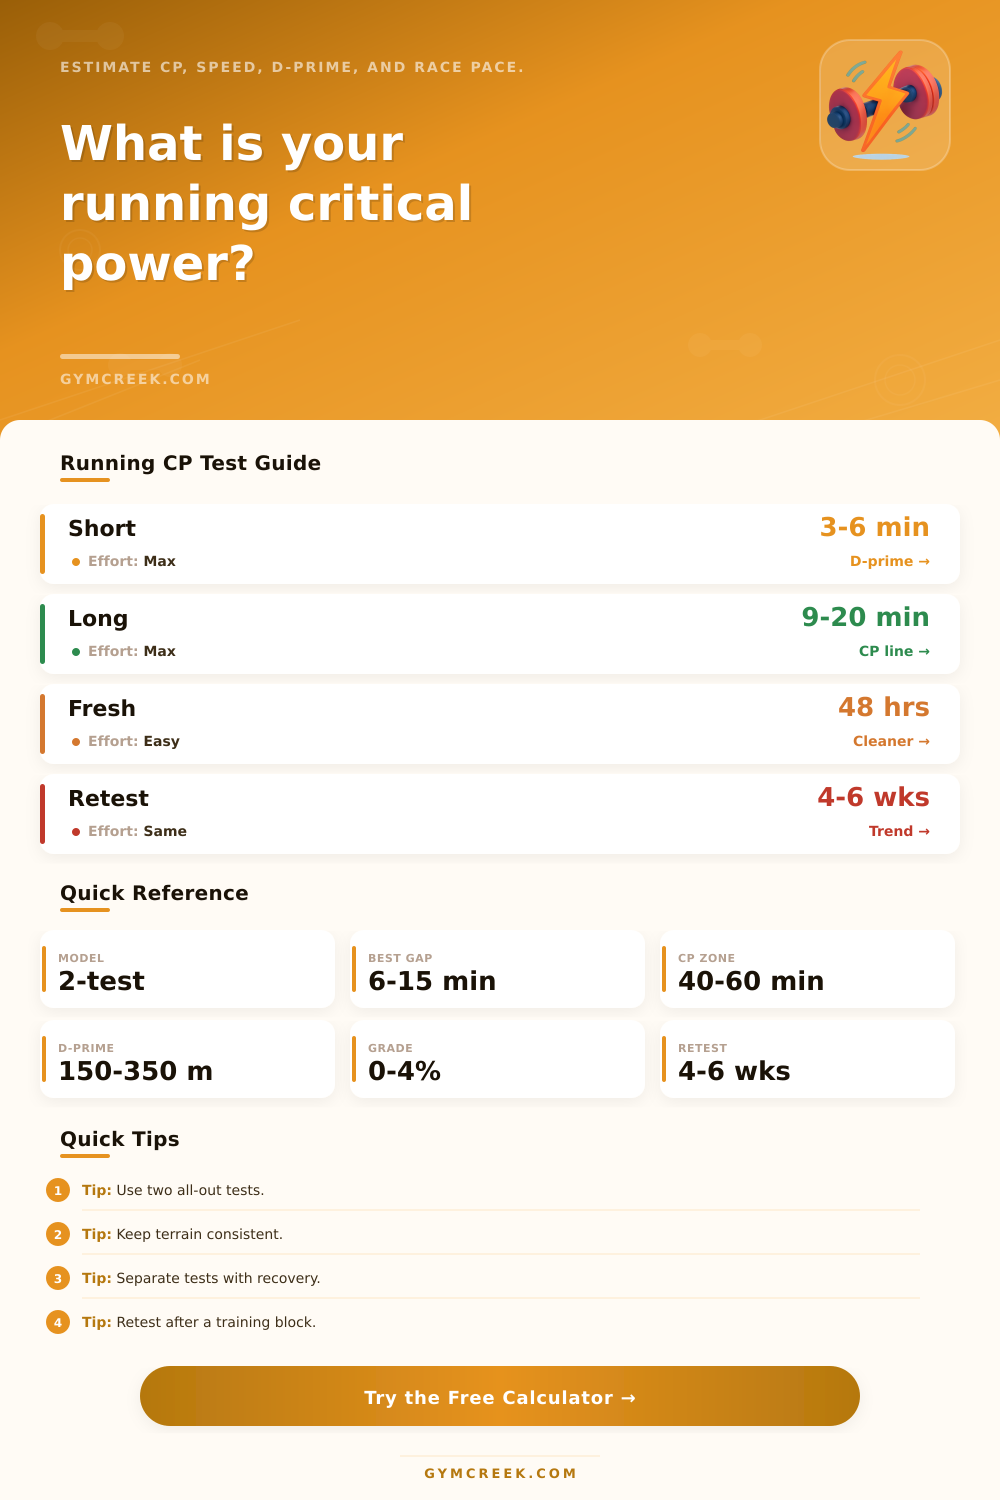
Use two maximal tests with different durations. A short 3-6 minute effort and a longer 9-20 minute effort usually make the model more stable.
⚙Calculator
Running CP snapshot
Enter two time trials to model your critical speed and power.
📊Metrics Comparison Grid
⏱Duration Comparison
📑Reference Tables
| Test piece | Duration | Purpose | Quality check |
|---|---|---|---|
| Short time trial | 3-6 min | Shows D-prime | Fast start, hard finish |
| Long time trial | 9-20 min | Anchors CP | Even pacing matters |
| CP validation | 30-60 min | Reality check | Near steady effort |
| Retest block | 4-6 weeks | Track progress | Same route or track |
| Zone | Power range | Typical feel | Running use |
|---|---|---|---|
| Easy aerobic | 65-80% CP | Conversational | Base mileage |
| Steady | 80-90% CP | Controlled | Long tempos |
| Threshold | 90-100% CP | Focused | Tempo intervals |
| Severe | 100-120% CP | Limited time | 3-10 min reps |
| D-prime | Interpretation | Common profile | Check |
|---|---|---|---|
| Under 120 m | Low reserve | Steady endurance | Check short test |
| 120-250 m | Balanced | Road racer | Usually stable |
| 250-400 m | High reserve | Mile to 5K speed | Watch pacing |
| Over 400 m | Very high | Speed biased | Retest long effort |
| Scenario | Better input | Risk | Adjustment |
|---|---|---|---|
| Hot weather | Recent tests | CP depressed | Use fatigue minus |
| Hilly course | Grade estimate | Power rises | Match terrain |
| Taper week | Fresh tests | Underpredict | Use small plus |
| Comeback block | Shorter retest | Old CP too high | Conservative bias |
| Formula | Variables | What it returns | Best use |
|---|---|---|---|
| Distance-time | d = CS x t + D' | CS and D' | Two hard runs |
| Power estimate | W = demand x speed x kg | Running watts | Flat to rolling runs |
| Target speed | v = CS + D'/t | Duration pace | Race checks |
| W/kg | W divided by kg | Relative CP | Compare phases |
💡Tips
At four minutes into a time trial, have you ever felt like your legs were like lead? That is when biology meets physics as explained by critical power model. It divides fitness into two components: sustainable endurance (the ability to sustain long efforts) and anaerobic reserve (a limited fuel source). To pace races well, not burn out early, you must know where those lines crosses.
Now that you have entered those two efforts into the calculator above, it do the math for you. It spares you the guesswork about what’s the right coefficient. All you need to do is make one long effort between nine and twenty minutes, and one shorter effort between three and six minutes. Those timeframes are important. They stress different metabolic pathway. The shorter effort assess how much speed you can take from your reserves. The longer effort set your actual steady-state ceiling. That’s why we want the gap to be at least six minutes. So the model doesn’t get confused about whether you’re testing for speed or endurance.
How Critical Power Helps You Run Better
Critical speed is velocity you could maintain indefinitely given the right conditions. In real life, this is not the pace you’ll ever run for any period of time. But it’s a good benchmark to use when looking at both your aerobic capacity and threshold work. D-prime tells you how far above this line you can go before becoming fatigued. If your D-prime value is small, then you’re more of an endurance type; sprints aren’t realy your thing. If your D-prime value is large, then you’ve got loads of speed, but may want to develop your base before tackling distance runs. That’s where most road racers fall: in between. And that’s why the reference table on the page break things down into those categories. This way, you do not have to rely on guesswork, feeling “effortful”) to figure out what your innate shape is.
Most runners mess up because of how they pace themself. At the beginning of the run you’re feeling great so you go out too hard. According to the model, begin slow (slower than desired) with reserves left over for later. Looking at the target pace that’s created for an assigned time frame, understand this also represent the drain on your limited bank account. Go at that pace for 20-minutes and you’re tapped. Run only at your critical speed and you remain fresh. It is a subtle yet critical distinction between dying on the line and finishing strong.
Keep in mind though when looking at this data, it’s also subject to weather and terrain. That can change the need for power significantly. Race in the mountains? Expect something different than if you tested on a track. Grade adjustment bridge that gap. You’re able to adjust for average incline, making sure the estimate relates to what you’ll see on race day.
Keep in mind, freshness is also important. Tired testing give you a false floor. Fresh testing gives you a ceiling. Neither is wrong; they just tell different stories about where you are on a particular day. Then you retest every few weeks to see if your training block is working as intended. Your D-prime should stay stable or increase slowly. Meanwhile, your critical speed should increases over time. If your base doesn’t budge but your reserve increases dramatically, well, you’ve gotten faster, but not stronger. That won’t lead to consistent racing.
So don’t just feel good about having a good split on Tuesday morning, use the numbers to guide your next phase. What you’re trying to create is balance. An engine that can hold itself together when it matters most. And when your legs turn to stone the next time around, you’ll know precisely why and how to prevent it next time.