Cricket Calorie Calculator
Estimate calories burned from batting time, bowling overs, fielding position, running between wickets, warm-up work, rest time, session length, and adjusted cricket MET logic.
📌Presets
Each preset loads a realistic cricket role and recalculates from role minutes, bowling overs, running demand, fielding position, and recovery time.
⚙Calculator
Cricket calorie snapshot
Enter batting, bowling, fielding, and session values to estimate cricket calories.
📊Fitness Metrics
🧮Formula Cards
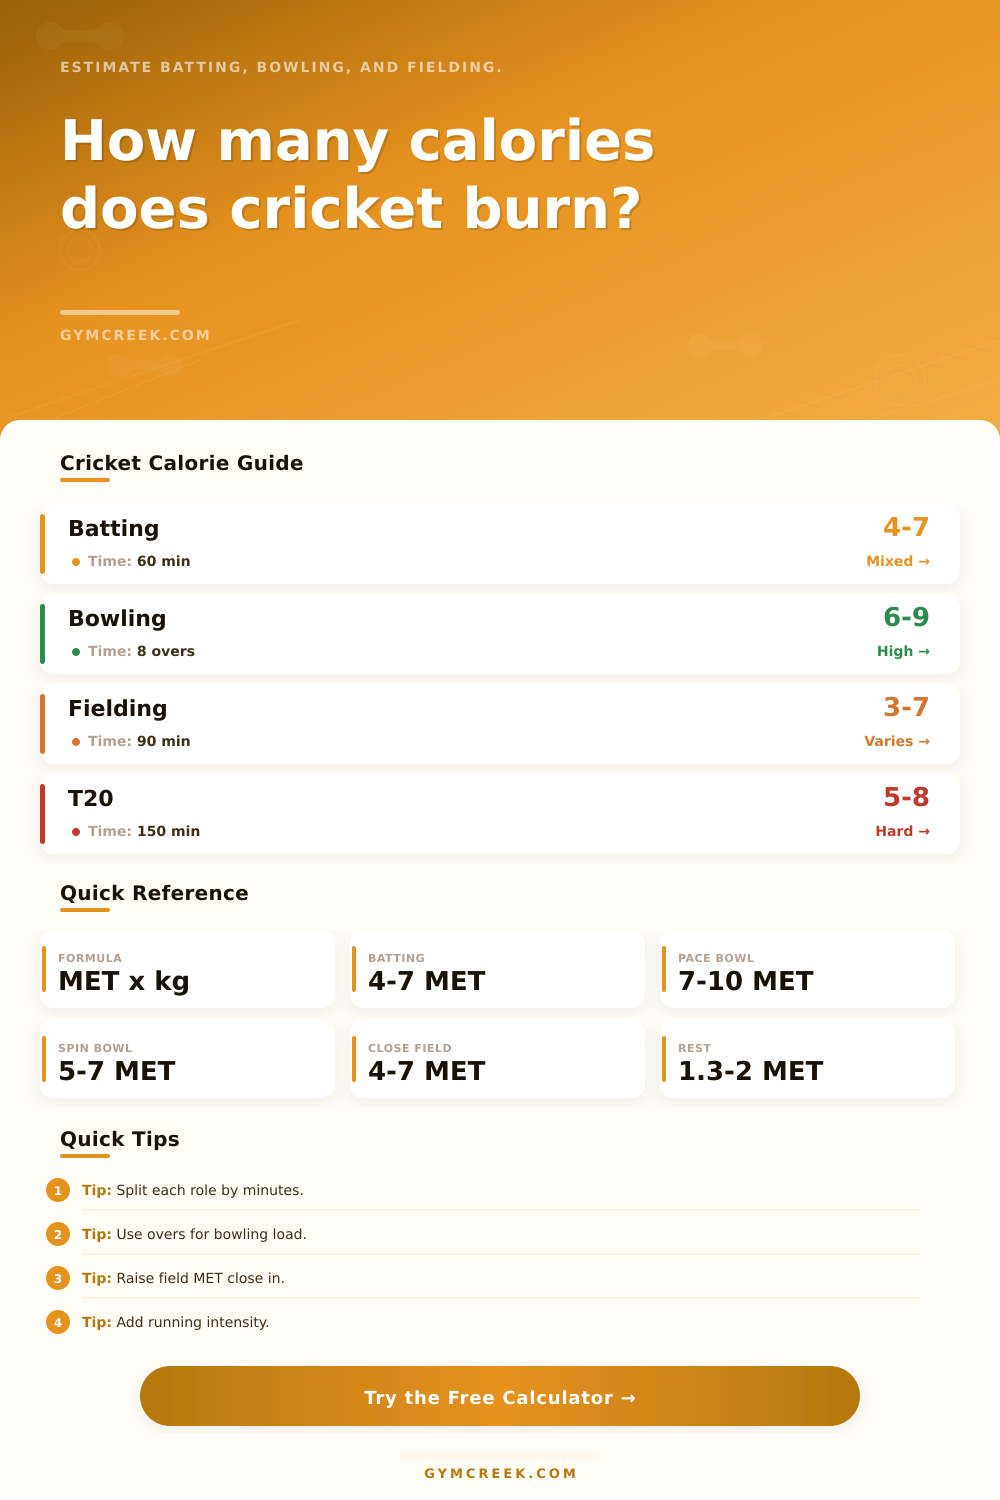
Calories per minute = MET x 3.5 x body weight in kg / 200. The calculator applies this separately to batting, bowling, fielding, warm-up, and rest blocks.
Batting starts from a format MET, then batting tempo and running between wickets raise or lower the active batting load.
Bowling style sets the base MET, overs bowled add workload pressure, and short high-effort spells are capped to a realistic cricket range.
Mifflin-St Jeor estimates BMR from age, body size, and gender, then the activity multiplier estimates TDEE for daily context.
📑Reference Tables
| Cricket Role | Light | Moderate | Hard |
|---|---|---|---|
| Batting innings | 3.8 MET | 5.2 MET | 7.2 MET |
| Spin bowling | 4.8 MET | 5.9 MET | 7.1 MET |
| Fast bowling | 6.5 MET | 8.0 MET | 9.6 MET |
| Wicketkeeping | 4.4 MET | 5.6 MET | 7.2 MET |
| Boundary fielding | 3.0 MET | 4.2 MET | 6.0 MET |
| Field Position | Base MET | Demand | Best Use |
|---|---|---|---|
| Wicketkeeper | 5.6 | Squat repeat | Full innings |
| Close catcher | 5.1 | Reactions | Spin overs |
| Inner ring | 4.7 | Quick stops | T20 and ODI |
| Boundary | 3.8 | Long chases | Large ground |
| Slip cordon | 3.4 | Static bursts | New ball |
| Format | Typical Time | Rest Share | Load Pattern |
|---|---|---|---|
| T20 match | 140-190 min | 15-30% | Dense bursts |
| One-day match | 300-420 min | 25-45% | Long blocks |
| Test day | 360-450 min | 30-50% | Variable |
| Net practice | 45-120 min | 10-30% | Role focused |
| Indoor cricket | 60-100 min | 8-20% | Repeat sprints |
| Formula | Variables | Output | When Used |
|---|---|---|---|
| MET kcal | MET, kg, min | Calories | Main estimate |
| Overs load | Style, overs | Bowling MET | Spell work |
| Run factor | Tempo, runs | Batting MET | Crease work |
| TDEE share | kcal, TDEE | Percent | Daily context |
💡Tips
It’s the morning of the match, and you’re fresh off the line; focused, sharp, and ready to destroy the opposition. By the time the final over arrives, though, you feel groggy and heavy-legged. It is not bad luck. You’ve been solving a math problem without knowing it.
Because the work load is broken up, cricket is deceptively demanding. Unlike soccer where you maintain a continuous run, in cricket you lurch between bowling, standing still, sprinting, and crouching. It’s difficult to estimate how much energy you expend. As a result, most cricketers base their estimate on the way they feel: subjective fatigue isn’t reliable. An inactive innings can exhaust your brain reserves without depleting sugar levels. A tense run-chase, however, could of left you panting despite running only a few minutes.
How the Calculator Works
Knowing how many calories you’re actualy burning enables you to refuel more efficienty and return to fitness sooner. So how does it do that?
Well, the tool above asks you to break down the exact roles you’ve performed in a cricket match. Total time on field isn’t what’s measured. It will separate your bowling stats from your batting ones (and even fielding). Why? Because they’re different.
Bowling, particularly fast bowling. Is an anaerobic, explosive activity. That big run-up require a massive burst of power followed by another huge surge for the delivery stride. Your body burns through its energy reserves very rapidly during a bowling stint. Four overs can be more physically taxing then 20 minutes of gentle batting. To account for that, the calculator asks you how many overs you bowled. It factors that into the intensity level, not simply the minutes spent batting. It acknowledges that a bowler’s workload isn’t linear. It spike.
Then there’s batting. That’s a combination of rapid bursts of speed and fine motor skills. Here you can also vary how fast you’re batting. This energy expenditure is called the calculator’s “batting tempo.” The less time on bat, the lower the energy cost (if you were in watch-the-ball mode, i.e., defending). Your metabolic rate are higher if you are going for a high target or caught in a power-hitting phase. Why? You can maintain a moderate heart rate while in a defensive innings, so any mental fatigue doesn’t show up. Then you go charging off between the wickets, and that’s when the physical load kicks in big time.
That’s where the running input comes into play. Singles and doubles add up. And those short sprints from stump-to-stump, they dissapears many calories without you noticing them. Short? Yes. Intense? Absolutely.
That leaves fielding. That’s where people get it wrong most of all. They think standing around in the outfield can’t be hard work? Errrrr….it is. Depending on what fielding position you select make a huge difference to the MET value. For example, the wicket keeper is squatting all day long so there’s a constant leg strain that elevates heart rate throughout. Or a boundary rider runs a lot less, but it’s full pelt whenever they do. You can use the calculator to show your fielding role and how hard you worked. Maybe you’ve thrown down some stumps and dived for a few catches today? Or maybe it was a low scoring game with very little action on the boundary?
The page has reference tables showing how these various cricket roles stack up. These suggest a busy slip cordon player will exceed a static boundary rider’s expenditure in a low-scoring game.
There’s also rest time to consider. A cricket match is full of long pauses. Time spent waiting on drinks breaks, appealing to the umpire, and then waiting again for the next batsman goes by, but not many calories are burned in those lulls. You’ll overestimate if you don’t take it into account. When asked how much rest and waiting time to expect, the tool wants a percentage of that down-time. That means your overall session average MET will be reasonable. If you’ve recorded ninety minutes of being out in the field, but spent forty percent of it standing around while the game paused to start up again, the calculator should account for that wait. It’s a little tweak, but allows you to use the figure when thinking about what to eat after the match.
This isn’t about nitpicking each and every one of those calories. This is about knowing the shape of your effort. If you know your bowling spell was the energy sink, you’re going to load up on carb and protein directly following the game. If you know your shift in the field was low-intensity, maybe you can hold off for a while before eating something.
The calculator does all the complicated math of combining these different levels of intensity. It provides a snapshot of where the energy has gone. All you have to do is be honest with yourself about how long you were at it and how hard you pushed. Then it’s time to let go of the guesswork and begin fueling with purpose.
It requires a lot of effort, but your preparation can meet that need.