Change of Direction Deficit Calculator
Compare COD test time against matched linear speed, then estimate change of direction deficit, ratio, side asymmetry, and adjusted turning skill.
📌Presets
Each preset loads realistic COD test times, matched sprint distances, surfaces, fatigue states, and side times, then calculates immediately.
⚙Calculator
Change of direction snapshot
Enter a matched sprint and COD time to calculate deficit, ratio, asymmetry, and adjusted skill.
📊COD Metrics Grid
🧮Formula Cards
linear equivalent = sprint time x COD distance / sprint distanceScales the straight sprint result to the same measured distance as the COD test.CODD = COD test time - linear equivalentShows how much time is lost because the athlete must brake, turn, and re-accelerate.COD ratio = COD test time / linear equivalent x 100Expresses COD cost as a percentage of matched linear speed.asymmetry = |left - right| / faster side x 100Compares left and right turn times when both sides were tested in the same session.📑Reference Tables
| COD Deficit Band | Typical Range | What It Suggests | Training Clue |
|---|---|---|---|
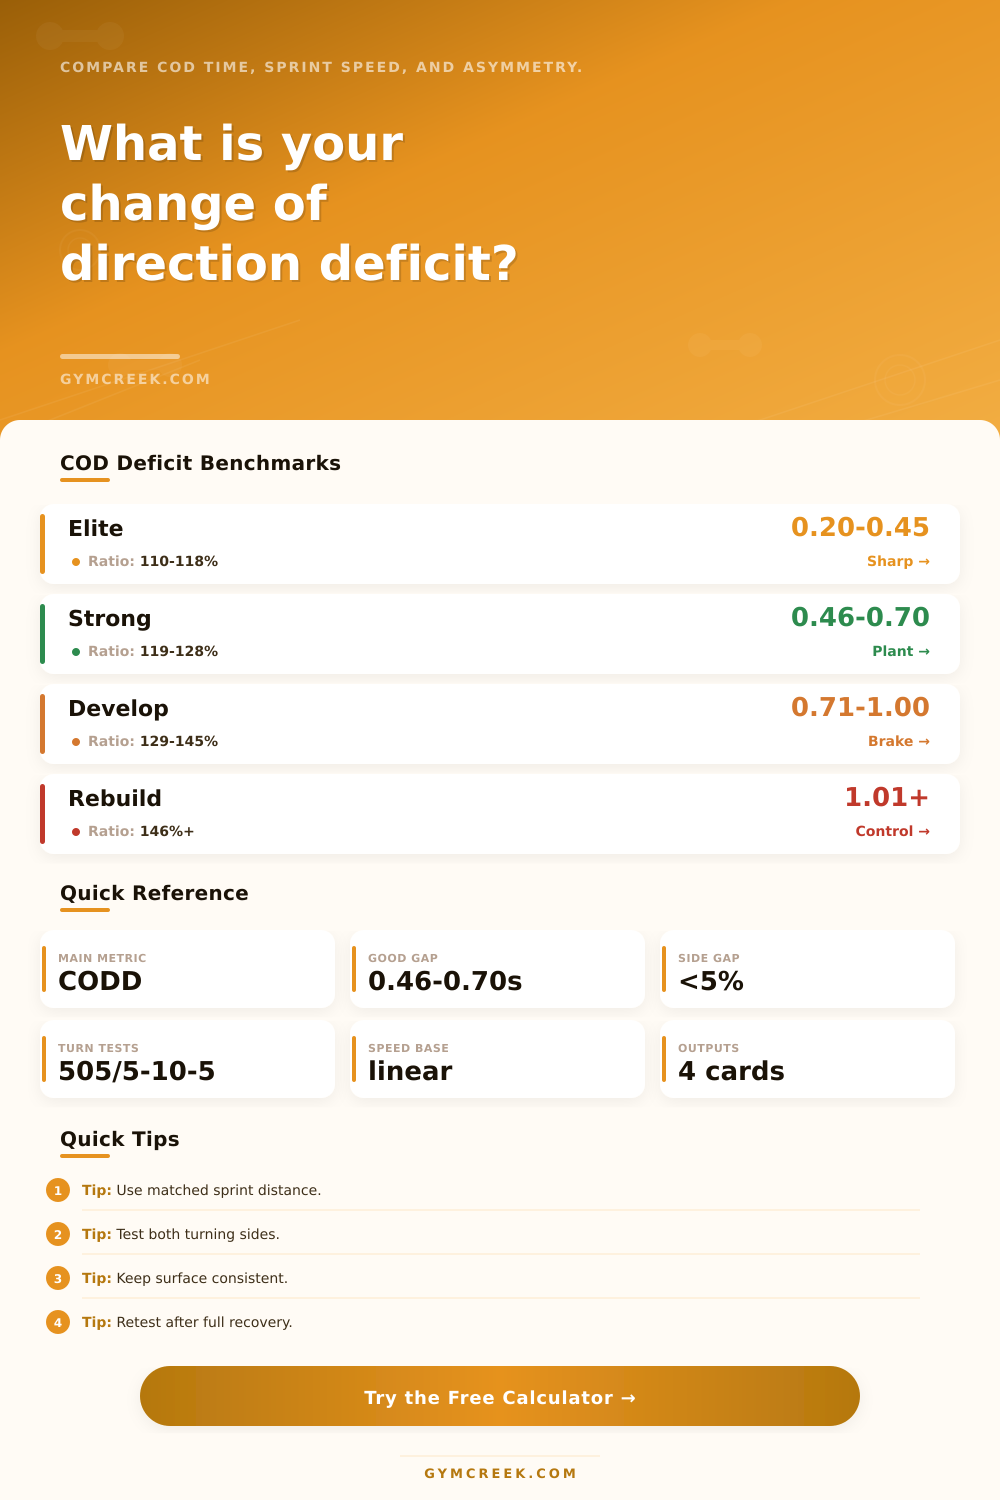
| Elite | 0.20–0.45 sec | Very efficient braking and re-acceleration | Maintain speed exposure and plant precision |
| Strong | 0.46–0.70 sec | Good COD skill with a manageable time loss | Refine entry speed and exit angle |
| Developing | 0.71–1.00 sec | Linear speed is not transferring cleanly | Prioritize deceleration mechanics |
| Rebuild | 1.01 sec or more | Large cost at the turn or transition | Reduce speed, improve control, then progress |
| Test | Common Timed Distance | Main COD Demand | Best Matched Sprint |
|---|---|---|---|
| 505 test | 10 m timed section | Single 180 degree cut | 10 m sprint |
| Modified 505 | 10 m or 5 m setup | Short approach, hard plant | 5–10 m sprint |
| 5-10-5 pro agility | 20 yd total | Two 180 degree turns | 20 yd sprint |
| T-test | About 40 yd path | Forward, lateral, backpedal | Matched shuttle distance |
| Asymmetry | Range | Interpretation | Next Check |
|---|---|---|---|
| Minimal | 0–3% | Both sides are closely matched | Keep monitoring |
| Small | 3.1–5% | Normal sport variation for many athletes | Compare repeated trials |
| Moderate | 5.1–10% | One side may need technical attention | Review plant video |
| High | 10%+ | Large left-right gap in this test | Use coach or clinician review |
| Formula | Variables | Result | Use |
|---|---|---|---|
| Linear equivalent | Sprint time, distances | Matched time | Distance normalization |
| COD deficit | COD time, linear equivalent | Seconds | Main COD skill score |
| COD ratio | COD time, linear equivalent | Percent | Relative turning cost |
| Asymmetry | Left and right times | Percent | Side comparison |
💡Tips
Knowing how to slow down is as important than being able to go fast. That’s the difference between a good player and an elite one.
It is not simply having raw power or top speed. You must know how to control it, brake effectively, plant a foot, and change direction while keeping your momentum without wasting any time. That’s what they call change of direction deficit. It’s the cost of turning. The less it costs you the better.
What Is Change of Direction Deficit
And that cost can be measured using the change of direction test compared to your linear sprint speed; something the calculator on this page will help you understand. It’s pretty simple logic. You take off in a straight sprint, and then cut and turn and test yourself. See how long it takes you to do both. How much slower were you running just because you had to turn around?
If you’re an efficient turner, that number will be tiny. If you have some trouble with your plant mechanics and braking, that number will increase. After you input your times, the tool does all the math for you. It uses only the exact distance you ran for your sprint so there aren’t any unfair comparisons. A 20 yard shuttle isn’t directly comparable to a ten meter sprint unless you make them equal by adjusting their distance.
The problem with many coaches is that they only look at the change of direction time by itself. Poor time can indicate bad technique, but it could also just be because their legs is slow. Without knowing how fast they run in a straight line, you don’t know which one is true.
That’s what the calculator gives you: the ratio of your turning time compared to your straight-line potential. A lower ratio is better, as that indicates you’re holding onto more of your straight-line speed while turning. In a sport like football where every tenth of a second matter, this is often the hidden difference.
The other thing to pay close attention to is the asymmetry information. Having one side of the body stronger than another is typical in most athletes. But if there’s a big discrepancy between the time it takes you to cut on your left versus your right then something might be up underneath. Maybe it’s strength related? Maybe it’s technical? Maybe it’s from an old injury where the imbalance has lasted.
If you put in two turns, one on each side; the tool will compare them. Then it tells you how much bigger your weaker side is compared to your stronger side (a percentage). Small amounts of asymmetry are generaly okay. Big ones aren’t. You don’t want to cover up a potential problem by working harder on conditioning. You want to find out about it earlier.
Few people realize how much more fatigue and surface can play into it. How do you think it will feel running on a fast indoor court versus a heavy wet field? With this calculator you can account for those. It outputs your estimated adjusted deficit. So you can see your results more fairly and understand what they are telling you.
If you get a high deficit on a poor surface, then that doesn’t necessarily mean you had a bad day or that your technique was bad. Perhaps the conditions simply weren’t good. In performance testing, context is everything.
In the layout, I include reference tables with different benchmark times for various levels of athletes. Deficits below ½ second are common in elite athletes. That’s some next-level braking and re-accelerating. Deficits up to a second (or greater) can occur in developing athlete. That means they could stand to improve their deceleration mechanics. In other words, they’re getting to their plant foot too quickly and losing control.
It’s time to stop worrying about going fast and start worrying about stopping well. You don’t get to use speed if you can’t direct it.
Also, consider your testing protocol. Warm up the same way. Wear the same shoes. Test yourself on the same surface. Otherwise, the comparison will be between a tired test and a fresh one, which is noise in the data. To help understanding of the result, the calculator prompts you for your fatigue state. This doesn’t alter the raw number, but it assists with interpreting that number. High deficit following a hard workout? That is no surprise. High deficit as fresh out of the starting gate? This is a training tip-off.
So all of this comes back to transparency. This eliminates the guessing game. This reveals exactly what’s costing you time. Is it the turn or is it the straight line? Now when you’re training, you know what you need to do. So you can go out and drill braking, you can refine your plant angle, you can work on symmetry. Because now you know how to close the gap.
You want to carry your speed from the turn into the straightaway. That’s the sweet spot. And that’s where efficiency is.