Body Weight Trend Calculator
Smooth daily weigh-ins into a clearer trend weight, compare your goal pace, estimate water-noise risk, and decide whether the scale is actually moving.
◎Presets
Each preset fills body stats, scale log, goal pace, and fluctuation context so you can see how trend weight differs from raw scale weight.
⚙Calculator
▦Seven-Day Scale Log
Use the same routine when possible: after waking, after bathroom, before food or fluids, and before training.
Body weight trend snapshot
Enter scale weights to smooth daily noise into a useful trend.
▣Fitness Metrics Grid
▤Reference Tables
| Window | Best for | Response | Noise control |
|---|---|---|---|
| 3-day | Fast feedback | Quick | Lower |
| 7-day | Most weigh-ins | Balanced | Good |
| 14-day | Diet review | Slower | Strong |
| 21-day | High fluctuation | Slowest | Very strong |
| Goal | Common pace | Signal | Review window |
|---|---|---|---|
| Fat loss | 0.25-1.0% BW | Deficit working | 14 days |
| Recomp | 0-0.25% BW | Slow change | 21 days |
| Maintenance | Within 0.25% | Stable trend | 14 days |
| Lean gain | 0.1-0.5% BW | Small surplus | 21 days |
| Cause | Likely effect | Duration | Trend note |
|---|---|---|---|
| High sodium | Water up | 1-3 days | Wait it out |
| High carbs | Glycogen up | 1-4 days | Not fat gain |
| Hard training | Inflammation | 2-5 days | Use average |
| Low carbs | Water down | 1-3 days | May overstate loss |
| Output | Formula | Inputs | Purpose |
|---|---|---|---|
| Trend weight | EWMA | Scale log | Smooth noise |
| BMR | Mifflin | Age, size, sex | Base burn |
| Lean BMR | Katch | Lean mass | BF known |
| Energy rate | 3500 kcal/lb | Calorie gap | Trend check |
◇Tips
It’s not lying, but it can’t tell the differance between retained water and muscle. A few extra pounds of water from having a salty steak don’t appear any different then two pounds of newly built muscle. And that’s the key, because short term changes will derail your long term progress. You wake up, weigh yourself, you’re not where your head wants you to be, you freak out, you think your diet isn’t working, blah blah blah. The problem wasn’t that your diet didn’t work. The problem was the way you understood one piece of information from a system that were meant to change.
The key is that the average are more representative of the truth than any given moment in time. By smoothing out day-to-day fluctuations, you can see what’s really happening to your body composition. Most folks do fine going back seven days, since this give you enough data to offset random fluctuations without being so long that you miss what’s happened recently. If you are on a carb-heavy refeed or experiencing extreme training stress, try going back two weeks (14 days) or three week (21). This helps smooth out the swings in glycogen storage and inflammation that can hides fat loss for a few days.
Why Weekly Averages Are Better Than Daily Weigh-ins
Enter your scale log into the calculator above; it’ll crunch the numbers for you, so you won’t have to guess if that big number up there is real, or just statistical noise. How does the number change? Knowing this will tell you what to do about it.
Sodium cause water weight to change rapidly by a pound or more in a day. Carbs hold multiple grams of bound water for each gram of stored glycogen. You’ll lose some water and shed pounds fast on a carb-cutting diet… but most of that is fluid loss from your muscle, rather than burning off pure fat. That explains the rapid early losses (and subsequent stalling) so many low-carb dieters experience. The scale isn’t just a reflection of your body’s energy balance; it also reflects your level of hydration. It’s important to realize this, so you don’t panic if the number doesn’t move despite strict adherence.
Of course, there’s another factor at play here: your metabolic rate. It’s difficult to estimate exactly how much fuel you’re burning, so you get a starting point from basal metabolic rate calculations. But you’ll burn far more calories through your daily activities and movement outside of exercise. So if you think your calories fall within the maintenance range but you’re still gaining weight, you may be eating bigger portions than what was measured, or less active than anticipated.
You can use the reference table included with the calculator to adjust your input numbers based off what you see happening in real life. For example, a five-hundred-calorie-a-day deficit should of result in a weight loss of about one pound per week. If after two weeks it doesn’t seem to match up with the trend line, you’ve probably miscalculated the calorie gap.
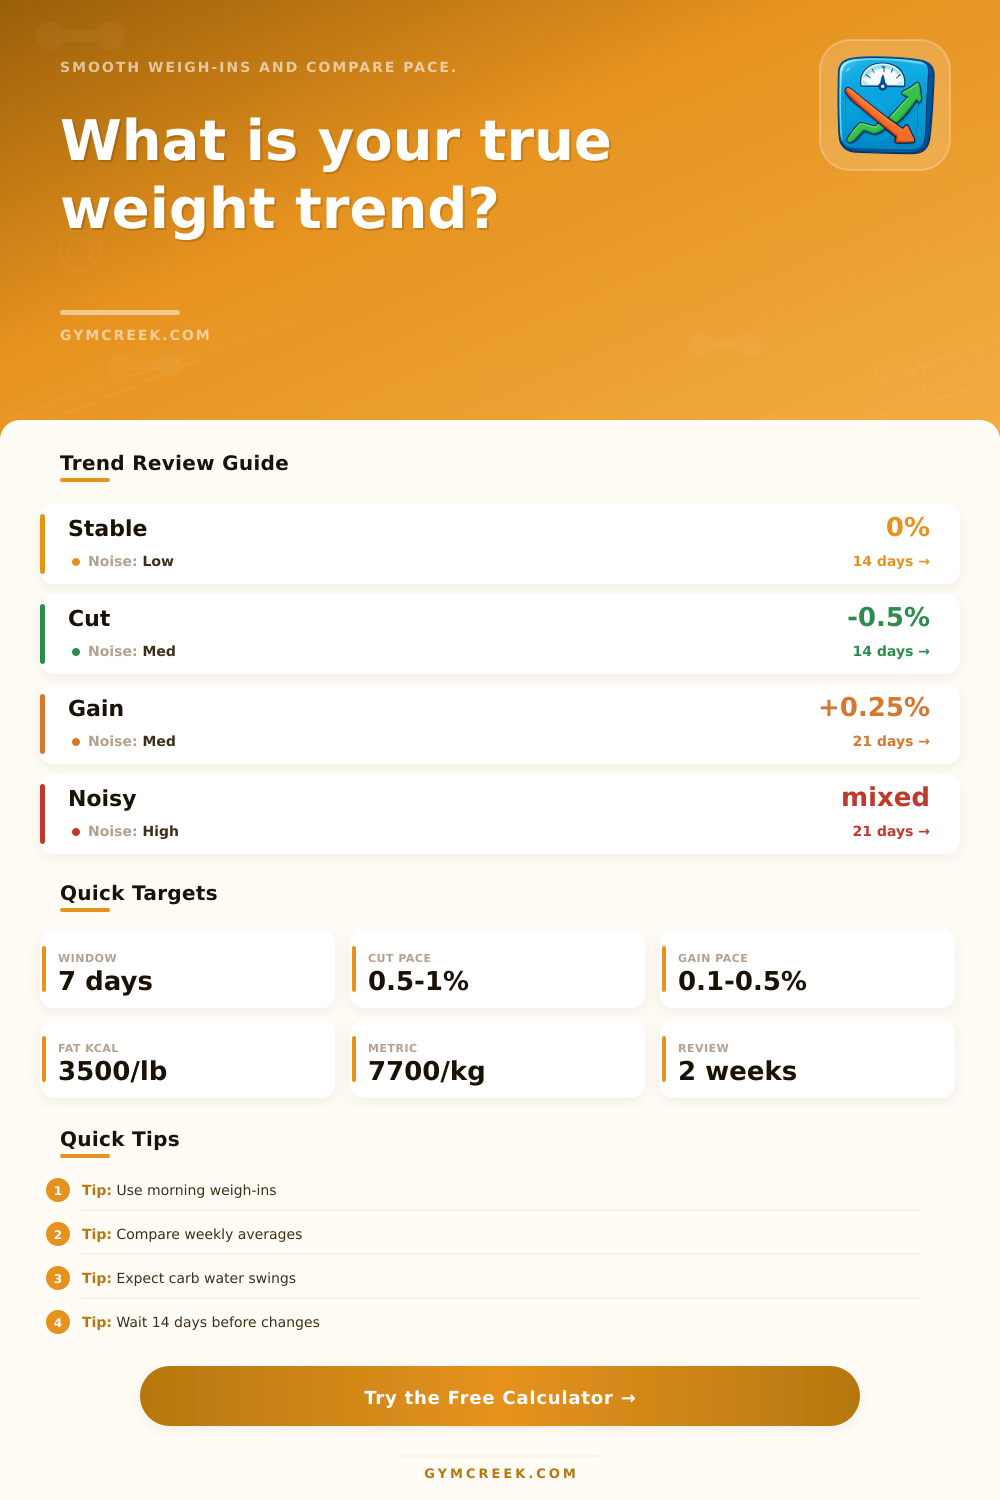
The most difficult variable to manipulate is patience. It mean doing nothing. The problem with most people is they react to one bad weigh-in instead of a prolonged trend by changing their training or diet too soon. In all honesty, they need at least two weeks to look back over and see if anything needs to be changed. That gives them enough time for their body composition to change and their water weight to level off. Otherwise, they’re chasing ghosts by changing something different every three days based on what happens day-to-day. They make things unstable that wasn’t already unstable.
This isn’t about being perfect with the numbers. This is about being clear with direction. Are you trying to gain muscle? Lose fat? Maintain your weight? If you’re doing things right, the trend will tell you whether or not your plan is working. A slow decline signals a calorie deficit. A flat line mean maintenance. A gradual increase means you’re eating at a surplus. Everything else is nothing more than noise.
When you smooth out the average, when you focus on what matters and ignore the daily drama, you take the emotion out of the equation. You trust the process instead of fighting the scale. Your number will go up and down; that’s unavoidable; but if you give it enough time, the trend never lies.