Basal Metabolic Rate Calculator With Body Fat Percentage
Estimate BMR from body fat percentage, lean body mass, sex, age, height, weight, activity level, and your current calorie goal.
📌Body Fat BMR Presets
Each preset fills realistic stats, body fat percentage, formula choice, activity level, and goal so you can compare lean-mass BMR estimates quickly.
⚙Calculator Inputs
BMR and lean mass snapshot
Enter body stats, body fat percentage, activity, and goal to estimate your resting burn.
📊Fitness Metrics Grid
📑Reference Tables
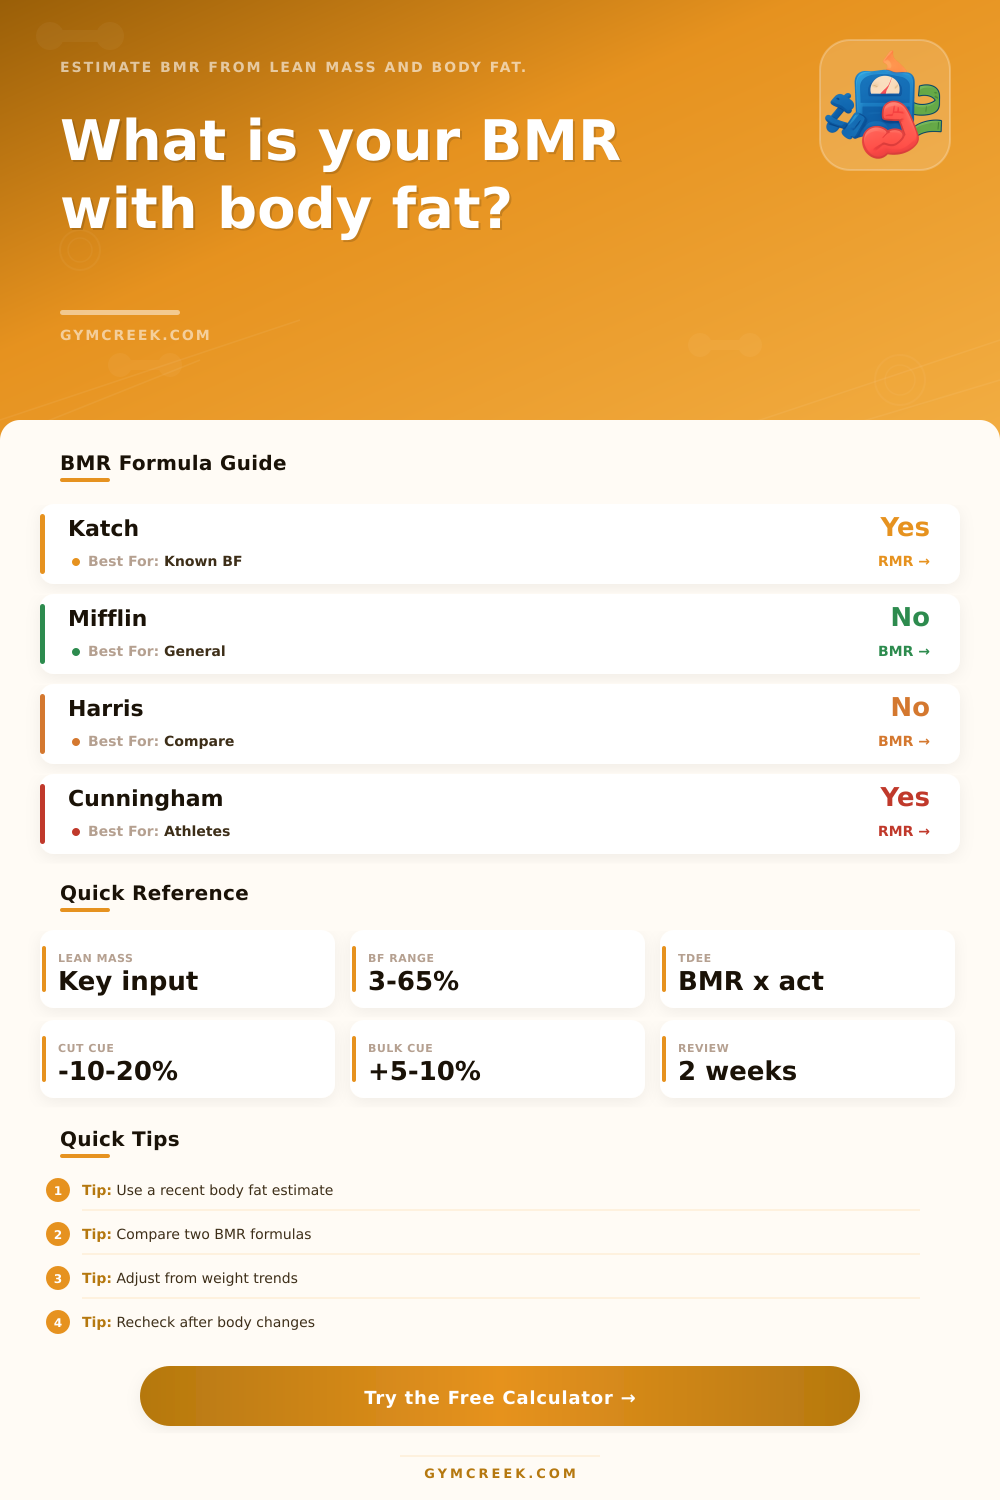
| Formula | Uses body fat? | Core inputs | Best use |
|---|---|---|---|
| Katch-McArdle | Yes | Lean body mass | Body fat known |
| Cunningham | Yes | Lean body mass | Active or athletic users |
| Mifflin-St Jeor | No | Age, sex, size | General adult estimate |
| Revised Harris-Benedict | No | Age, sex, size | Legacy comparison |
| Manual measured RMR | Optional | Lab or device result | Known measured value |
| Level | Factor | Training pattern | Movement context |
|---|---|---|---|
| Sedentary | 1.20 | 0-2 light sessions | Mostly seated |
| Lightly active | 1.375 | 2-3 weekly sessions | Some walking |
| Moderately active | 1.55 | 3-5 weekly sessions | Regular training |
| Very active | 1.725 | 5-6 hard sessions | High daily movement |
| Extra active | 1.90 | Daily hard training | Labor or athlete |
| Group | Lower | Middle | Higher |
|---|---|---|---|
| Male athletes | 6-13% | 14-17% | 18-24% |
| Female athletes | 14-20% | 21-24% | 25-31% |
| General male | 10-20% | 21-25% | 26%+ |
| General female | 18-28% | 29-33% | 34%+ |
| Goal | Target cue | Protein cue | Review window |
|---|---|---|---|
| Fat loss | About -20% | High | 2 weeks |
| Slow cut | About -10% | High | 2-3 weeks |
| Maintenance | No change | Moderate | 2 weeks |
| Recomp | About -5% | High | 3-4 weeks |
| Lean gain | About +8% | Moderate | 2 weeks |
| Performance | About +5% | Moderate | Weekly |
💡Tips
Calorie counting is like balancing your checkbook. For most folks, it’s about keeping the books balanced, put something into a calorie tracker; take something out when you eat; hope the numbers adds up in real world.
There is a problem with those calculations. Body composition are a huge variable left unaccounted for by most standard equations. Basal metabolic rate formulas treats a pound of muscle the same as a pound of fat. It’s a core calculation mistake in metabolic accounting. Adipose tissue doesn’t burn as many calories at rest compared to muscle tissue. When we fail to account for this, we’re creating a blind spot which can make dieting feel like fighting against gravity.
Better Ways to Count Your Calories
But we want to prioritize our lean body mass as opposed to overall body weight, so the calculator above does that for you. In doing so, it moves beyond vanity metrics into physiological reality. By entering your body fat percent, the calculator removes the non-metabolically active portion of your body and then computes the burn using what’s actualy burning calories. A small change in inputs makes a huge difference in accuracy. The formulas listed below (Katch-McArdle and Cunningham) are built to do exactly this. They use lean mass and not just gender/age alone. Why? Because two people with the same height and weight could have very different metabolic engines given widely varying amounts of muscle mass.
But more important than nailing the baseline is understanding what your activity multiplier should be. This is spelled out plainly enough on the page, but you have to be honest about it. You’ll see most folks overestimate their level of activity. If you sit at a desk all day and do weight lifting three days per week, calling yourself moderately active would of been a mistake. You’d eat in a surplus where you wanted to cut. Instead, it’s better to err on the low side and adjust upward rather than starting higher and wondering why you can’t get the scale to budge. You can tweak this factor with the tool, closing that gap between theory and reality.
In particular, I’d draw attention to protein. Protein is one of those nutrients with a special property: it has a greater “thermic effect” than fats or carbs. In other words, your body expends more energy breaking down protein compared to either of these two macronutrient. Depending on your lean mass and goals, the calculator will set appropriate protein goals to match. For example, when in a cut, maintaining higher levels of protein will help maintain lean body mass. Which itself drive your metabolic rate. Losing weight while losing muscle is the fastest way to crash your metabolism. This is the fastest way to crash your metabolism. Your body becomes a more effective fat-storing machine. You don’t want to rip out the engine; rather, you want to protect it.
And then there’s the thing about re-checking your numbers every few weeks. Your body will adapt to both calorie surplus and deficit. We call this process adaptive thermogenesis. When you’re losing weight, your metabolic rate will decrease slightly. When you gain mass, your metabolic rate can increases somewhat. The tool has an adjustment option that accounts for this. That metabolism isn’t some static, carved-in-stone number. It’s dynamic. It varies based off diet, training volume, sleep, and stress. You’ll be able to respond instead of reacting if you treat metabolism like this.
It takes the guess work out of your starting point, which is the beauty of this approach. When you have an idea of how many calories you burn at rest, it’s all just math and time from there. You’ll be able to figure out how much food to eat (or not eat) in order to gain muscle or lose fat without binging or starving yourself. It turns eating healthy from a guessing game into something structured. Then it’s all about listening to your body when you see how it reacts to the information. Keep going if you’re feeling lean and strong. Tweak the number of calories up/down a bit if you’re not seeing movement on the scale after two weeks.
It’s about understanding your physiology instead of fighting it. Facts, not feelings, drive your moddern metabolic engine.