BMI Waist Circumference Calculator
Combine BMI, sex-specific waist cutoffs, waist-to-height ratio, and activity estimates for a clearer adult body-size risk snapshot.
📌Presets
Presets load realistic adult profiles with different heights, waist sizes, activity levels, and combined-risk patterns.
⚙Calculator
BMI and waist snapshot
Enter height, weight, waist, sex cutoff, and activity level to calculate risk markers.
📊Fitness Metrics Grid
📑Reference Tables
| BMI | Category | Formula Note | Use |
|---|---|---|---|
| <18.5 | Underweight | kg/m² | Screen low weight |
| 18.5-24.9 | Healthy weight | kg/m² | Baseline range |
| 25.0-29.9 | Overweight | kg/m² | Check waist |
| 30.0+ | Obesity classes | kg/m² | Review risk |
| Sex Cutoff | Inches | Centimeters | Meaning |
|---|---|---|---|
| Male | >40 in | >102 cm | Higher risk |
| Female | >35 in | >88 cm | Higher risk |
| At cutoff | Monitor | Monitor | Near threshold |
| Below cutoff | Lower | Lower | Use with BMI |
| BMI Range | Waist Below Cutoff | Waist Above Cutoff | Risk Logic |
|---|---|---|---|
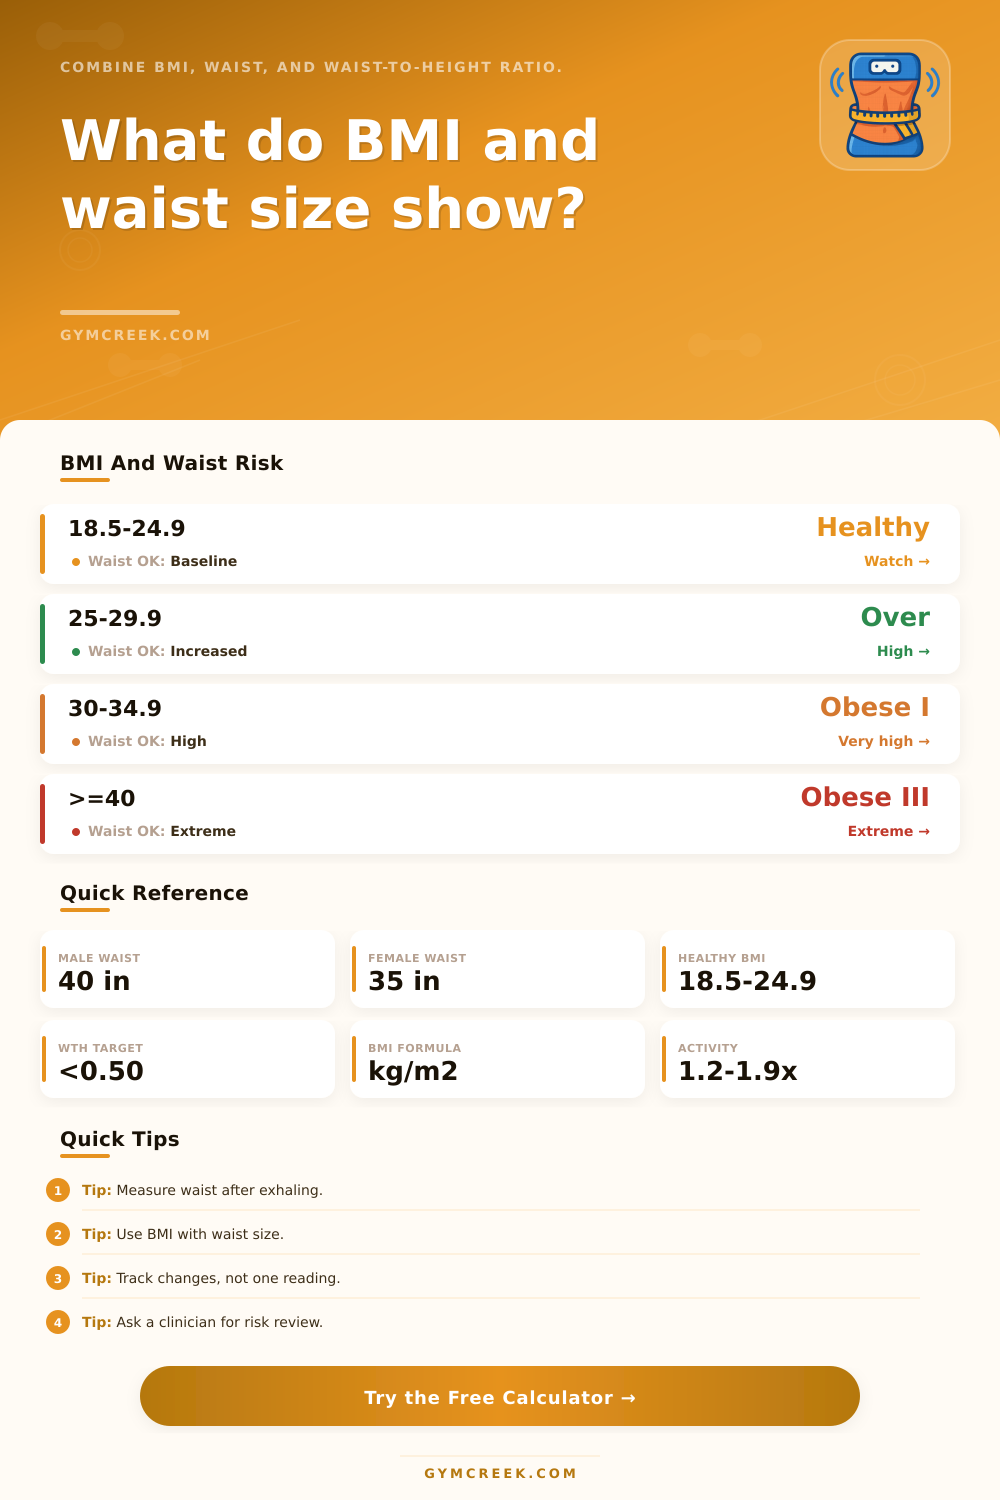
| 18.5-24.9 | Baseline | Waist watch | Adiposity check |
| 25.0-29.9 | Increased | High | NHLBI table |
| 30.0-34.9 | High | Very high | NHLBI table |
| 35.0+ | Very high | Very high+ | NHLBI table |
| Waist / Height | Range | Signal | Use |
|---|---|---|---|
| Low | <0.40 | May be low | Review weight |
| Preferred | 0.40-0.49 | Lower waist | Track trend |
| Increased | 0.50-0.59 | Waist focus | Act early |
| High | >=0.60 | High waist | Clinical review |
| Formula | Variables | Output | When Useful |
|---|---|---|---|
| BMI | kg, m | kg/m² | Body-size screen |
| Waist gap | waist, cutoff | in or cm | Central fat screen |
| WtH ratio | waist / height | ratio | Height-adjust waist |
| Mifflin | kg, cm, age | cal/day | Activity estimate |
💡Tips
Most people know what BMI (body-mass index) is, and it classifies one’s weight into categories: Underweight, Normal, Obese, etc. Unfortunatly, it doesn’t differentiate between muscle vs. Fat, which can lead to false positives. For example, a person who is very muscular might be considered “overweight” on the BMI chart but actualy be healthy, while someone who’s normal-weight might have dangerous levels of abdominal fat, also known as visceral fat.
That’s where waist circumference fills in the blank, it better explains the risks to one’s health. You don’t have to calculate out the numbers yourself, either; simply plug your stats into the calculator at the top and let it do its thing.
Why Waist Size is Better Than BMI
Waist size. A measure of central adiposity: Because fat that accumulates around midsection (near the intestines and liver) is metabolically active, releasing inflammatory markers and hormones that raise the risk of diabetes and heart disease. Subcutaneous fat, such as the kind found on your thighs or hips, isn’t as risky.
To see if you have this type, measure your waist using a normal breath-out, right about where your hip bone are. The tool has separate cutoffs for men and women because fat storage patterns differs between the sexes. Generally, men gain belly fat sooner, while women more often store fat under the skin before menopause. That’s biology.)
The tool also includes another helpful metric: the waist-to-height ratio. In general, it’s recommended that the waist be less than half your height. So if you’re five foot ten, for instance, your waist shouldn’t be more than twenty-nine and a half inches. It’s an automatic scale based off your frame.
For example, a guy who’s six foot tall can has an absolute waist bigger than one who’s five feet tall. It also helps you understand whether you’re at any particular risk or not. Pairing this with BMI gives you something like two dimensions instead of just one, and that little tweak make it all much more accurate.
These figures should of been understood based on their activity levels. Because muscle requires more energy to maintain than fat, the calculator assumes you burn through more calories while sitting around if you’re relatively muscular compared with someone who isn’t. A high BMI resulting from lifting weights is probably going to give you a higher resting metabolic rate. By giving you options on your activity level, the calculator won’t mistake your muscly body type as being unhealthy just because it’s heavy. It lets you contextualize what the computer sees for it, and thus avoids misjudging your overall health status otherwise.
There are also presets to illustrate the impact on results given different body shapes. For example, you could examine the difference between a profile for someone who’s a strength athlete versus a lean runner and still weigh the same amount. Even though they might be the same weight, because the latter has more muscle, it change the results quite a bit. This shows that your numbers aren’t certainties but instead an estimate based on averages.
The interface includes reference tables showing that as your waist gets bigger and/or your BMI does, so does your risk. In other words, higher BMI plus higher waist = much higher metabolic strain different than each metric alone.
Tracking these numbers doesn’t need to be perfect… It just needs to be consistent. Don’t fret about daily shifts in pounds (or inches around your waist). This is normal due to differences in sleep, digestion, water retention, and more. Instead, view it over the course of weeks, or even months. Oftentimes you’ll find that your clothes will fit looser before your actual weight drops on the scale. This is called visceral fat loss; it’s the good stuff for your overall health.
Just remember: the numbers are only valuable if they influence what you do. Let the numbers tell you how to change your habits. Then, let your habits steers your journey. It’s not where you start that matters; it’s the direction that you’re headed. Measuring yourself will help you stay on track.