Body mass index, or BMI, helps to estimate the amount of fat in the body by means of height and weight. It gives a general idea about the healthiest weight. Charts of BMI categories show ranges for such states as underweight, overweight and obesity.
Generally, for adults healthy BMI falls between 18.5 and 24.9. Other source mentions a range of 20 until 25 for adults. That is only a rough pattern.
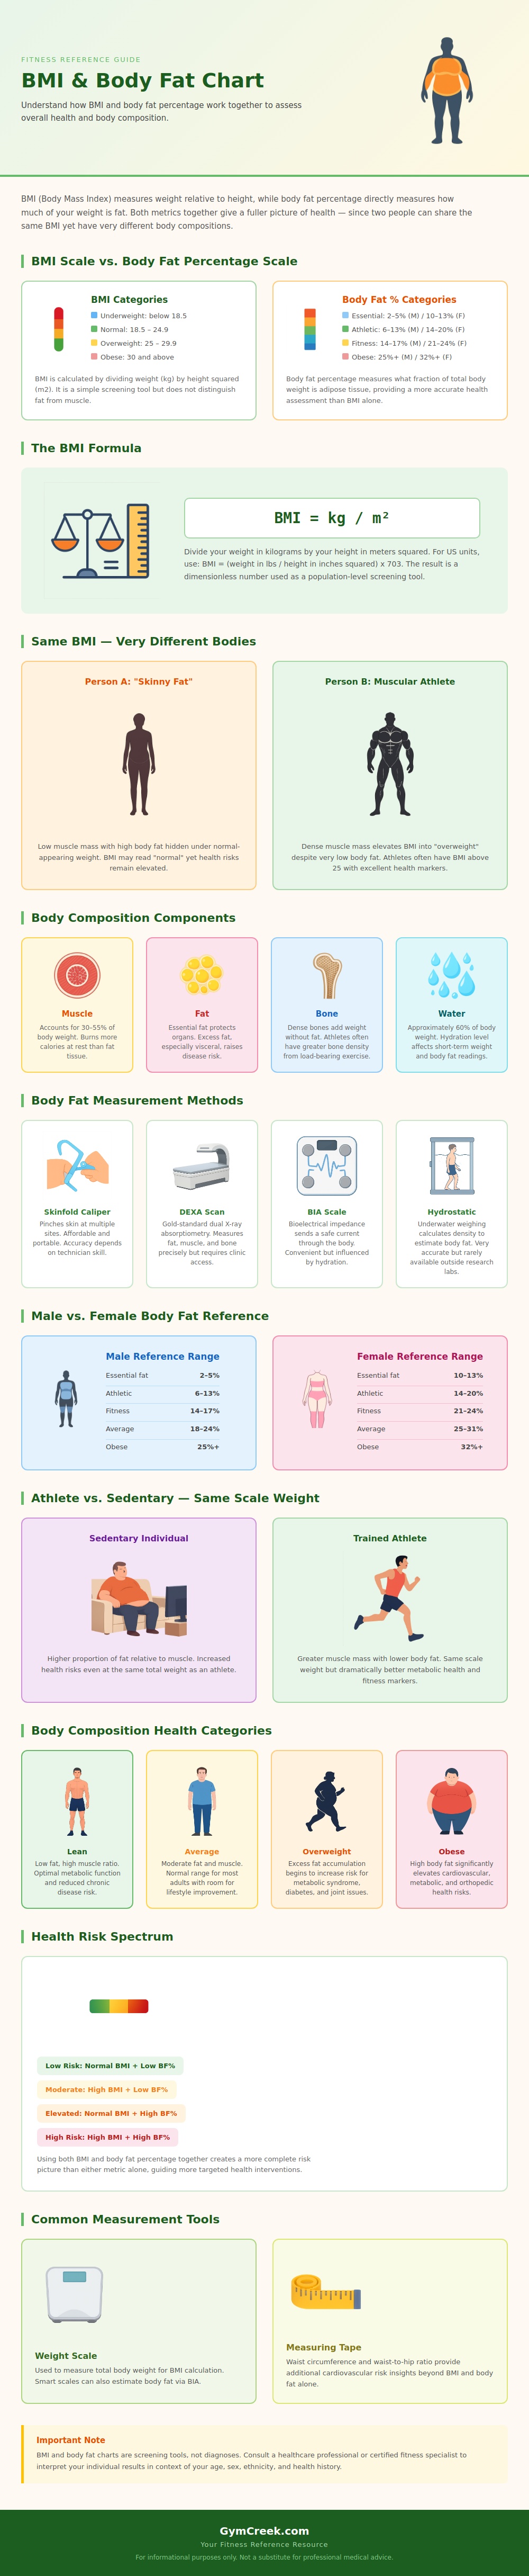
What BMI and Body Fat Say About Your Health
You can use it to estimate risks of diseases linked to body fat. High BMI together with wide waist can warn about higher risk of heart disease.
Seriously know that BMI is only one of many tools. It does not consider muscle mass. Professional athletes usually fall differently because of their muscles.
Weight same can mean different thickness at much shorter people. Some use BMI to estimate groups instead of individuals. Scales depend strongly on hydration.
They best serve for control changes in body fat, not for exact measure.
Body fat percentage shows more clearly the shape of a person. Estimate it instead of BMI helps to understand fitness much better. Clinical groups as the American Society for Clinical Densitometry and the International Society for Clinical Densitometry recognizes DEXA as the main method for analyze body makeup above BMI.
By means of DEXA you can follow results over time and stay in healthy ranges for different activity levels. At older age women have a bit higher healthy fat ranges. Risks however grow quickly in higher categories or obesity.
At men active folks have around 12, 20% body fat, although this shifts slightly upward with age.
The normal body fat amount alters with age in children and teens. It differs between boys and girls. For children and teenagers BMI is calculated according to age and sex.
CDC-developed growth charts explain that. For children you plot the result on age- and sex-specific growth curves to find BMI-percentile. Various calculators measure body fat percentage by means of methods as U.S. Navy, Covert Bailey, Jackson-Pollock or Durnin-Womersley.
They help to count needed weightloss for reach ideal fat range.