RPM to MPH Calculator Stationary Bike
Convert stationary-bike cadence RPM into virtual MPH using effective wheel circumference, flywheel or console rollout, gear ratio, resistance, bike type, ride duration, and target zone.
📌Spin-Bike Presets
Presets load realistic indoor-bike RPM, effective circumference, gear ratio, resistance scale, ride duration, target zone, and calibration assumptions.
⚙Calculator Inputs
Stationary bike RPM to MPH snapshot
Enter cadence, rollout, gear ratio, resistance, bike type, duration, and target zone.
📊Metrics Grid
📑Stationary-Bike Reference Tables
| Step | Formula | Input | Output |
|---|---|---|---|
| Raw kph | RPM x circumference x gear x 60 / 1000 | Cadence and rollout | Speed before resistance |
| Raw mph | Raw kph / 1.609344 | Raw speed | MPH baseline |
| Load factor | 1 - bike drag x load percent | Resistance and bike type | Indoor speed correction |
| Distance | MPH x hours | Speed and duration | Miles ridden |
| Zone | Typical RPM | Resistance feel | Best use |
|---|---|---|---|
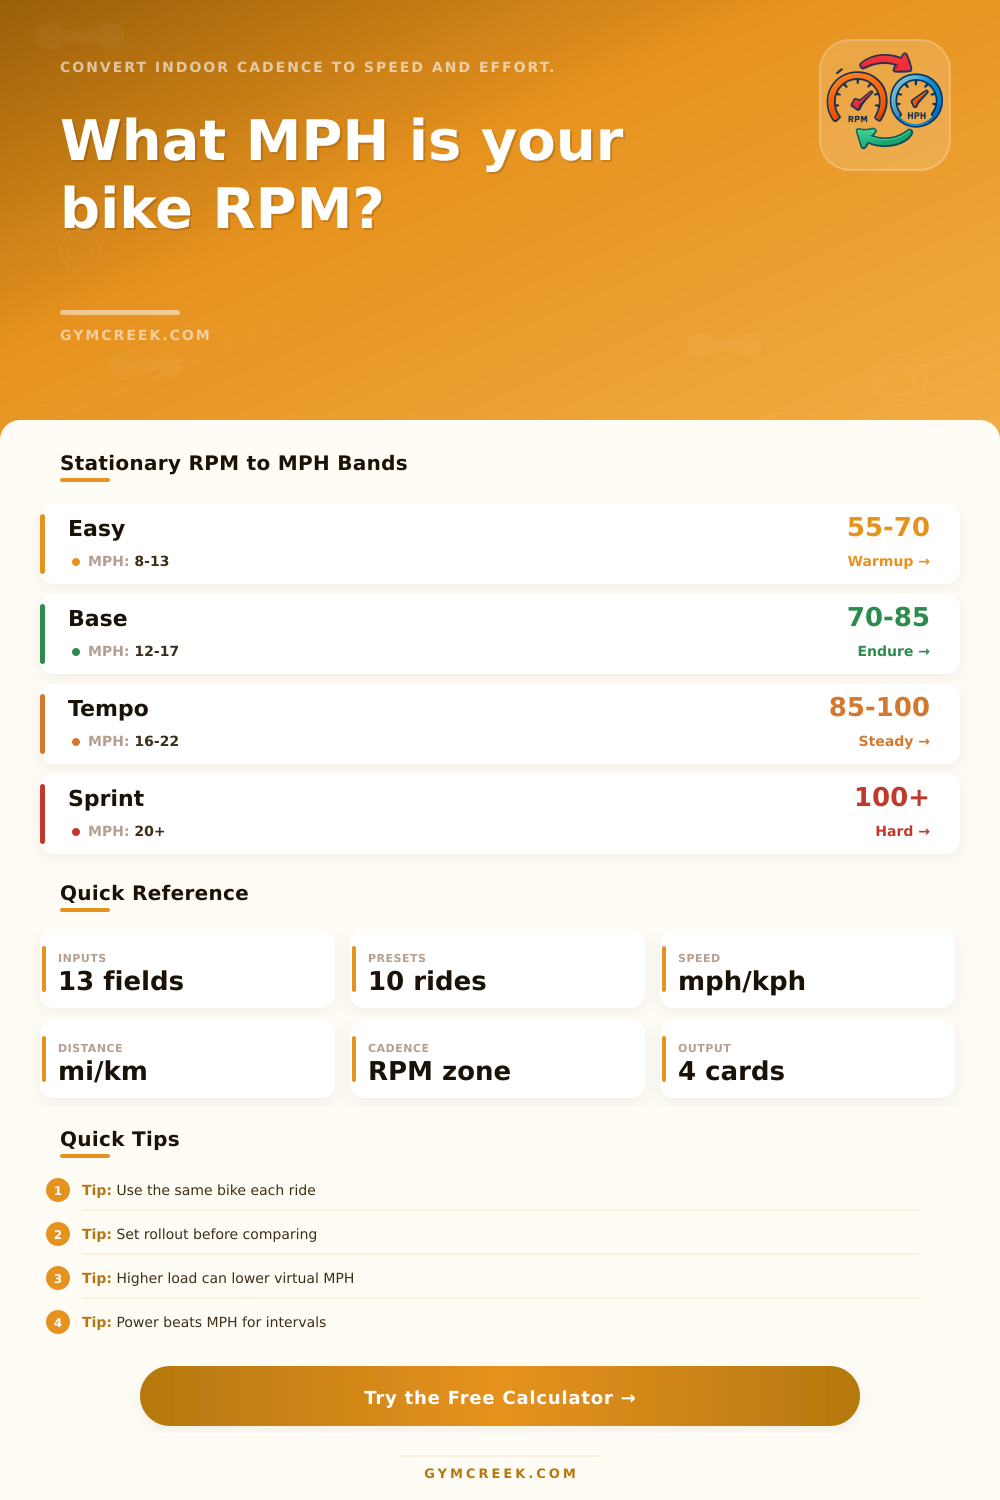
| Recovery | 50 to 70 rpm | Light | Warmup, cool-down, easy legs |
| Endurance | 70 to 90 rpm | Light to moderate | Zone 2 and aerobic base |
| Tempo | 85 to 100 rpm | Moderate | Class blocks and steady work |
| Threshold | 90 to 105 rpm | Firm | Hard repeatable efforts |
| Sprint | 100 rpm plus | Moderate to high | Short accelerations |
| Setup | Rollout | Speed effect | When to use |
|---|---|---|---|
| Compact console | 1.70 m | Lower MPH per RPM | Small upright bikes |
| Studio cycle | 1.95 m | Moderate MPH per RPM | Spin-bike classes |
| Road default | 2.105 m | Road-style display | Smart bike default |
| Large virtual wheel | 2.32 m | Higher MPH per RPM | Trainer apps or 29er feel |
| Bike type | Curve | MPH note | Best comparison |
|---|---|---|---|
| Spin bike | Magnetic or friction | Stable once calibrated | Same bike, same knob scale |
| Upright bike | Console magnetic | Usually conservative | Distance and cadence logs |
| Recumbent | Smooth supported load | Lower power feel | Comfort-focused endurance |
| Air bike | Cadence-sensitive fan | Hard RPM changes fast | Power and calories first |
💡Tips
When you are done with your spin session, and the console displays 86 RPM, it is natural to want to understand what 86 RPM means. The meaning of 86 RPM is dependent upon the size of the wheel, the gear ratio, and the amount of resistance that the flywheel is fighting. Without knowing each of these variable, the figure of 86 is merely an abstract number.
The calculator can convert the number of cadence revolutions to a virtual wheel speed because the calculator accounts for the variable of wheel size, gear ratio, and resistance in its calculations. Many bikes will feel different than other bikes at the same RPM. For instance, a bike with a compact wheel will travel less distance per revolution of the pedals than a bike that is set to the dimensions of road bike.
What 86 RPM Means on a Spin Bike
Thus, if you adjust the circumference of the bike, the virtual speed will change. This is one of the reasons that two individuals may record different virtual speeds, even while using the same bike. The resistance level will also have an impact upon the virtual speed that is displayed on the console.
For example, if the resistance levels are low, the virtual speed will be lower; perhaps in the low twenties, despite the high cadence of the individual performing the spin. If the user turns the resistance knob to a higher resistance level, the virtual speed will drop in relation to the number of RPMs of the spin. The calculator accounts for this increase in load upon the flywheel to display the appropriate virtual speed.
The console also displays the cadence zone in which the individual’s RPM is occurring. For example, if the RPM is below 70, it is performing recovery spin. If the RPM is between 70 and 90, it is performing endurance intervals.
If the RPM is between 90 and 100, it is performing tempo intervals. If the RPM is above 100, it is performing sprint intervals. Each of these values have been established to coincide with the power curves of the bikes.
Thus, utilizing this data allows the individual to select the target zone that they wish to utilize for that particular spin session. Beyond the virtual speed, the console also displays data regarding the power of the individual. For instance, the estimated watts will increase with an increase in either cadence or load.
However, the relationship between watts, cadence, and load isnt linear; it is possible to exert more watts at 75 RPM with a moderate resistance setting than with 95 RPM on a bike with light resistance. The effort score is a number from 0 to 100 that reflects the individuals cadence, the load with which they were fighting, the exertion of their effort, and the ratio of watts to the individuals body weight. As with the speed and cadence variables, each of these variables can impact the score.
Though many individuals may undervalue the efforts that they perform at low cadence or low speed, the effort score makes those efforts visible within the context of the spin session. Other variables outside of those accounted for by the console will also impact the performance of the individual. Variables such as tire pressure on a smart trainer, crank length, and even hydration can impact the performance of the individual on the bike.
Another variable is the calibration of the bikes; because it is possible that the calibration of the bikes drifts over time, it is possible that the console display can be incorrect. To account for this potential incorrect reading, it is possible to employ a calibration multiplier that will adjust the virtual speed to that which has been performed in previous spin sessions on that same bike. An approach to cycling that is beneficial to employ is to select one bike and stick with the same settings for that bike.
If the individual can log spin sessions using the same variables, it will be possible to compare those sessions. For instance, if the effort score increases but the virtual speed remains the same, it is an indication of that the individual is increasing the amount of resistance within their spin session. If the virtual speed increases with the same resistance level, it is an indication that the individual is either increasing their cadence or their fitness level.
These comparisons are only beneficial if the same variables are held constant. The reference tables that are provided on the page can help to confirm the variables entered into the calculator. For instance, the tables can be used to confirm that the virtual wheel speed with a rollout of 2.105 meters is appropriate for a road bike.
Similarly, the tables can be used to confirm that applying a 15% drag to the smart trainer accounts for the increased resistance to the flywheel. By converting the cadence rate of an individual to a comparable virtual speed, those who use the calculator will develop an understanding of each of the variables of cycling. For instance, instead of relying upon the virtual speed to make decisions about spin sessions, individuals will use the effort score, the power band, and the target zone to make those decisions.
In this way, individual will no longer be making decisions based off the virtual speed display of the console. You should of checked the settings first. Its important to recieve accurate data.
Most moddern bikes is better than old ones. Dont forget to check the bikes length. Youll need to do this alot.