Bike Aero Drag Calculator
Estimate cycling aerodynamic drag, CdA, required watts, drag force, energy cost, and fitness context from rider position, speed, wind, grade, and air density.
📌Presets
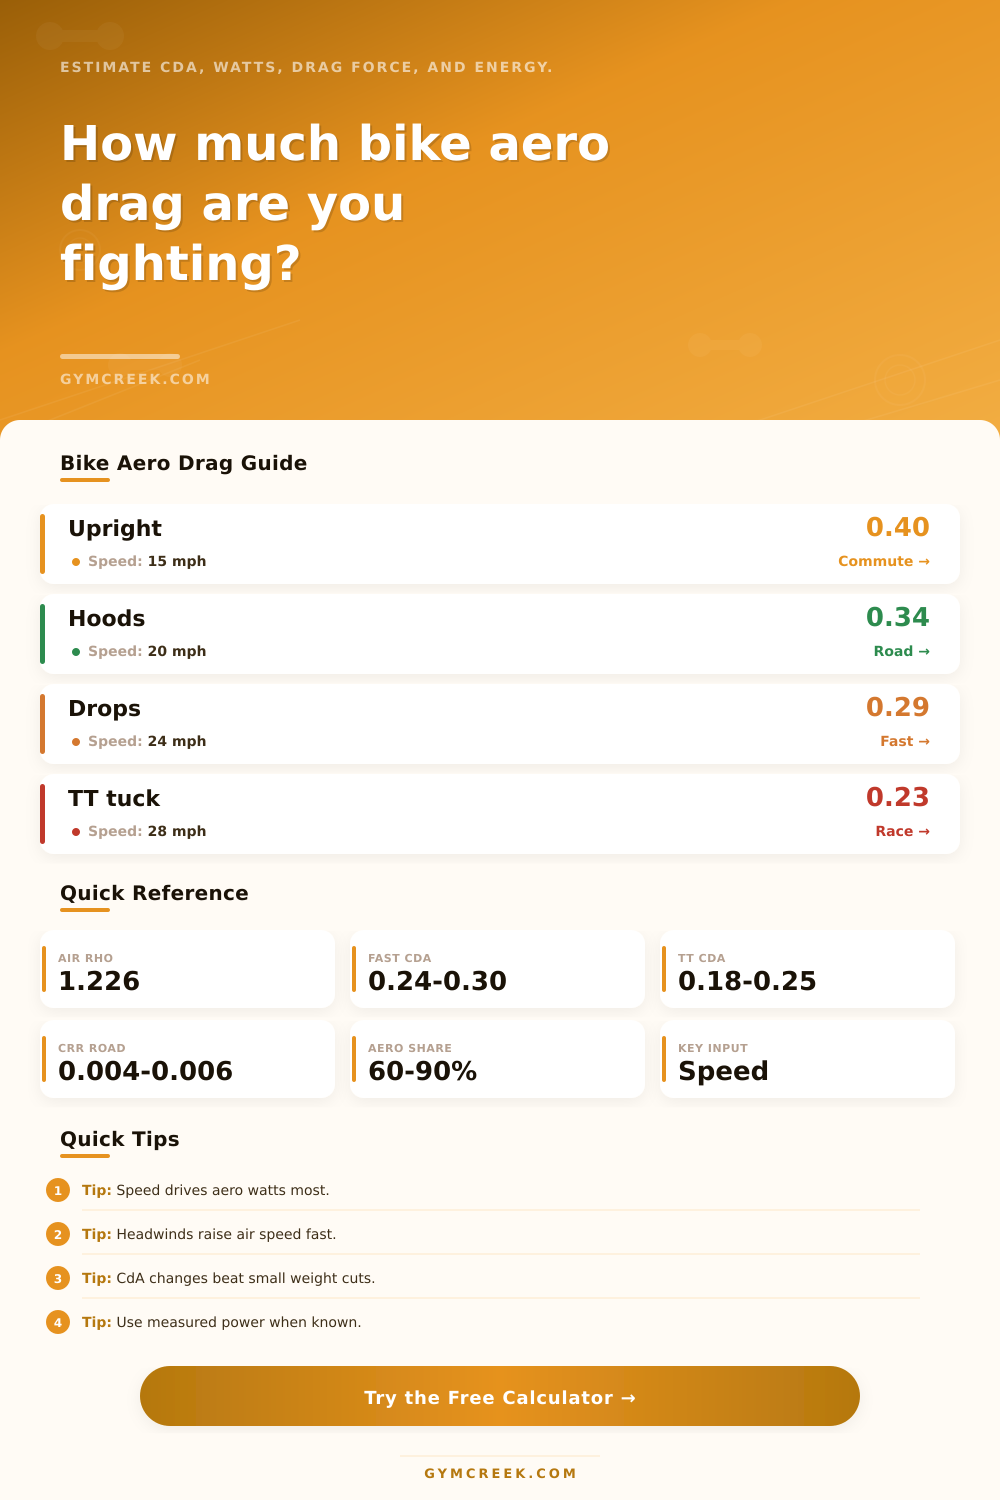
Presets load realistic bike aerodynamics scenarios and calculate aero watts, drag force, total power, energy demand, and the share of effort spent pushing air.
⚙Calculator
Bike aero drag snapshot
Enter rider size, position, speed, wind, and road conditions to estimate drag and power.
📊Fitness Metrics Comparison Grid
📑Reference Tables
| Riding Position | Typical CdA | Best Match | Aero Notes |
|---|---|---|---|
| Upright city posture | 0.38-0.50 m² | Commuting, flat bars | High torso exposure |
| Road hoods | 0.31-0.40 m² | Endurance riding | Common road baseline |
| Low drops | 0.27-0.34 m² | Fast solo riding | Lower torso and elbows |
| Aero hoods | 0.24-0.31 m² | Road racing | Narrow arms matter |
| TT or tri tuck | 0.18-0.27 m² | Time trials | Position must be held |
| Track pursuit | 0.17-0.24 m² | Velodrome efforts | Very optimized posture |
| Speed | Aero Demand | Typical Share | Training Meaning |
|---|---|---|---|
| 15 mph / 24 km/h | Modest | 40-60% | Rolling still visible |
| 20 mph / 32 km/h | Large | 60-75% | Position begins to dominate |
| 25 mph / 40 km/h | Very large | 75-85% | Small CdA changes count |
| 30 mph / 48 km/h | Race critical | 80-90% | Aero fit becomes decisive |
| Headwind day | Higher | Variable | Air speed beats ground speed |
| Condition | Typical Value | Formula Role | Power Effect |
|---|---|---|---|
| Sea level standard air | 1.226 kg/m³ | Air density | Baseline drag |
| Cool dense air | 1.275 kg/m³ | Air density | More aero watts |
| Hot or humid air | 1.170 kg/m³ | Air density | Less aero drag |
| Moderate altitude | 1.060 kg/m³ | Air density | Lower aero watts |
| Fast race tires | Crr 0.0035 | Rolling power | Lower non-aero load |
| Rough gravel | Crr 0.0120 | Rolling power | Higher total watts |
| Formula | Variables | Output | Use |
|---|---|---|---|
| Drag force | 0.5 × rho × CdA × v air² | Newtons | Force from air |
| Aero power | Drag force × ground speed | Watts | Power to push air |
| Rolling power | Crr × mass × g × speed | Watts | Tire and road load |
| Grade power | mass × g × grade × speed | Watts | Climbing load |
| Energy cost | watts × time / efficiency | kcal | Fuel estimate |
💡Tips
When you stand still on a windy day, you probably notice the wind pushing against you. It’s trying to push you backwards. Now imagine being on your bicycle moving forward at twenty miles per hour and feeling that same wind. That’s aerodynamic drag which becomes the dominant type of resistance at faster speeds.
Many cyclists focus on reducing weight in their setup before anything else. Why? Because they think that will matter. Lighter components like wheels becomes the goal. Or losing some body weight. But if you’re not going up steep hills, then it’s less about weight and more about air resistance.
Why Air Resistance Matters More Than Weight
Fortunately, bike aero drag calculator can do those math problems for you. But understanding how they work can help you make smarter decisions out on the road. The main part of this calculation is called CdA, or frontal area times the coefficient of drag. That’s a fancy way of saying how much area your body shows to the wind and how hard that wind pushes back.
For instance, someone sitting up has a relatively high CdA (big area facing into the wind) while someone tucking their head down over the handlebars create less drag (lower CdA). The calculator will estimate that number given your riding position and height. For more accuracy, you can put in measured CdA if you know it (such as from a wind tunnel test).
The bigger thing is that increasing speed change the level of power needed to defeat drag. Because the force exerted by the wind rises quickly as you increase speed, aerodynamic power rises with the cube of speed. That means it takes eight times more power to push twice as fast. If drag is claiming half your effort at fifteen mph, at twenty-five mph it can eat up eighty percent or more of your effort.
And because this relationship exists, it also explains why even slight adjustments in body position make such a big difference at high speed. An inch change in shoulder drop can reduce your power expenditure by several watts. Add all those watt savings up over time and you get the idea. As you can see from chart on the page, aerodynamics take over at higher speeds.
The chart serves as a reference table. You don’t need them as much if you’re riding slow on relatively flat ground. Cycling is also impacted by wind direction. Headwinds make you work harder by adding to your forward speed (thus increasing the effective air speed striking your body). So if you’re riding at twenty miles per hour into a ten mile per hour headwind, it feels like you’re pushing against 30 mph of wind. To make up for the greater effective speed, you’ll need to put out more power.
Conversely, a tailwind will lighten your load by lowering the relative wind speed. You can enter your wind conditions on the calculator and see what a gusty day will cost you in additional effort. The calculator also takes into account air density, since hot, thin air produces less drag than cold, dense air. Altitude decreases air density somewhat, causing lower drag and a lighter spinning load even though oxygen availability is lower.
The remaining two forces pushing back on the cyclist are the effects of rolling resistance and gravity. As the tire rolls it deforms, which also dissipates energy. More force is needed to keep going if the tire is underinflated or if the road is rougher. Gravitational force also come into play when climbing, with no regard for the effect of air resistance. When climbing steeper hills, far less of your power goes towards overcoming air resistance. You’re not battling the wind anymore, but instead fighting your own weight.
By adding together aerodynamic drag, rolling resistance, and gravity, the tool calculate the total power being used. That way, you can see where your energy is spent across forces. If you know what these numbers mean, you can make better decisions about where to train and upgrade. For instance, an aerodynamic helmet might save a few watts here or there. You save five watts. You can drop five pounds of bodyweight. You get a lot more benefit on the climbs and nothing much on the flats, unless you’re very draggy. It’s all about how you apply the solution, find the kind of resistance you encounter and adapt.
If it’s mostly flat riding, work on reducing wind resistance through position/equipment. If it’s hilly, get lighter (power-to-weight). Let’s face it; you’re busy learning strategy, so let the calculator handle the math for you. Enter your information and get back an approximation for calories expended and watts required. By putting a number to this expense, we can see the consequences of decisions made while out on the road. This adds some much needed context to our training efforts.
You could compare scenarios like riding on the hoods or in a tuck during a time trial. What about riding into a headwind versus no wind at all? Plug those numbers into the calculator and see what happens. This isn’t rocket science but data without insight doesn’t matter. You’ll quickly realize that air resistance is significant, and something you cannot avoid. But you can learn to push more efficienty through it. Understanding wind resistance turns an invisible barrier into something you can manage to improve your cycling performance.