Baseball Calorie Calculator
Estimate calories burned during baseball games, practices, tournaments, bullpen sessions, and two-way player days with position, innings, batting, running, pitching, warmup, and adjusted MET logic.
📌Presets
Each preset loads a realistic baseball workload and recalculates calories from fielding time, throwing volume, sprint bursts, hitting volume, rest, and warmup.
⚙Calculator
Baseball calorie snapshot
Enter game structure and baseball workload to estimate calories.
📊Fitness Metrics
🧮Formula Cards
Calories per minute = MET x 3.5 x body weight in kg / 200. The calculator applies it separately to fielding, running, batting, throwing, warmup, drills, and rest.
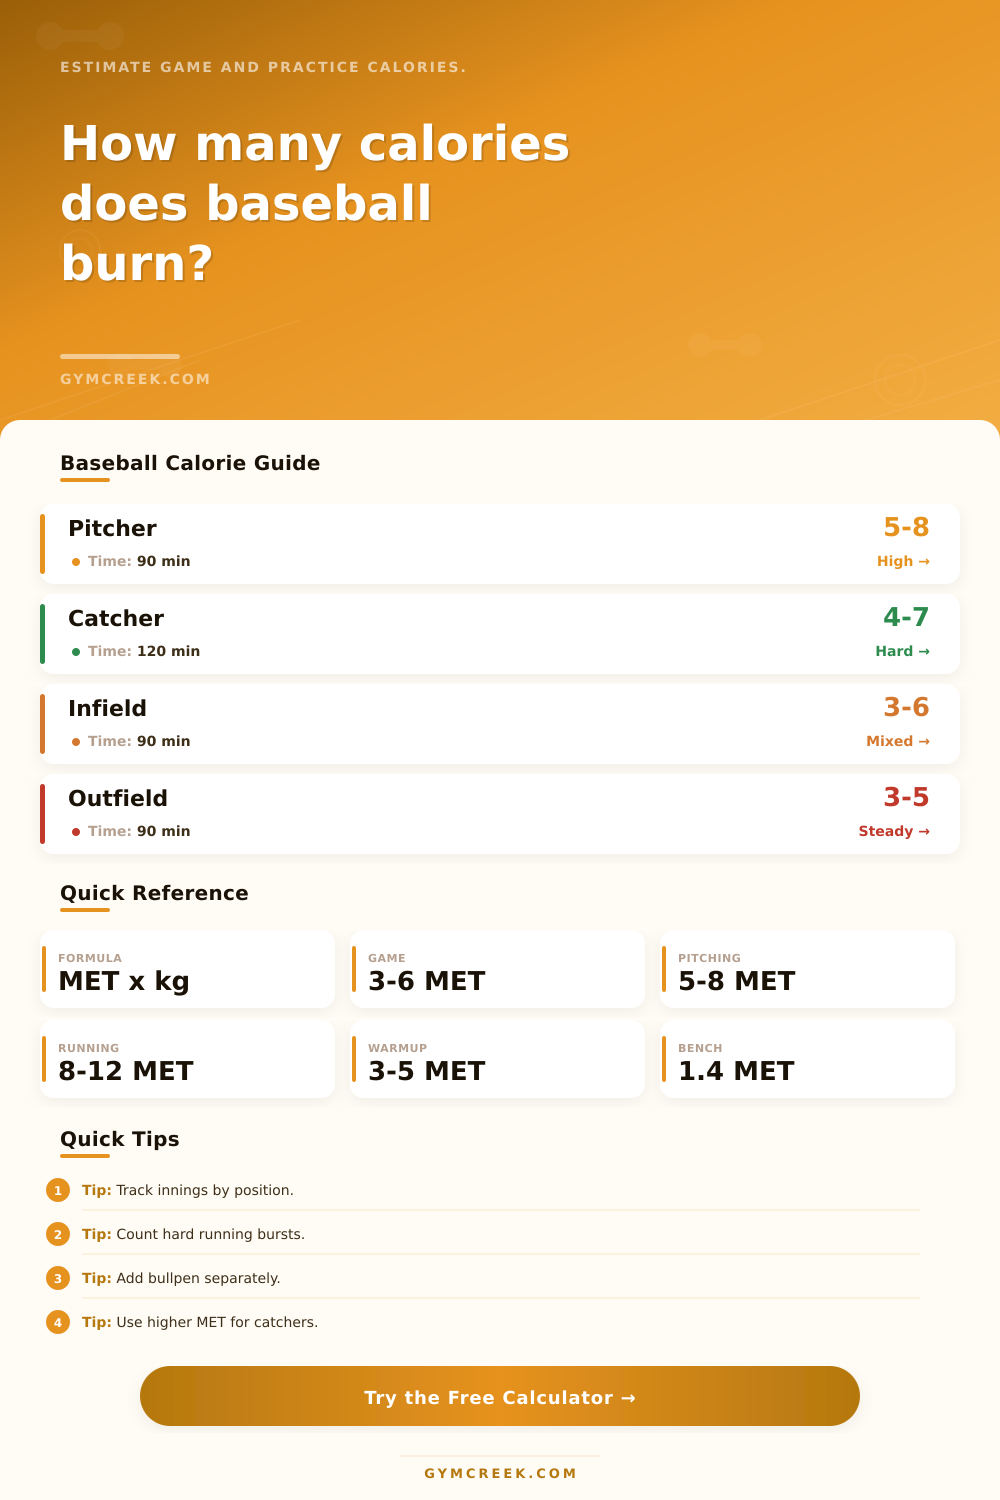
Pitchers, catchers, infielders, outfielders, first basemen, designated hitters, and two-way players start with different fielding MET bands, then intensity adjusts the inning load.
Plate appearances, hard swings, base-running attempts, pitch count, and bullpen minutes add short high-intensity work that a simple game-duration estimate misses.
Mifflin-St Jeor estimates BMR from age, height, weight, and gender, then the activity multiplier estimates TDEE so the baseball session can be compared with a full day.
📑Reference Tables
| Position | Light | Normal | Hard |
|---|---|---|---|
| Pitcher | 4.8 MET | 6.2 MET | 7.8 MET |
| Catcher | 4.6 MET | 5.8 MET | 7.2 MET |
| Infield | 3.5 MET | 4.6 MET | 6.2 MET |
| Outfield | 3.1 MET | 4.0 MET | 5.4 MET |
| Designated hitter | 2.0 MET | 2.7 MET | 3.4 MET |
| Workload | Typical Input | MET Used | Best Use |
|---|---|---|---|
| Warmup | 15 to 35 min | 3.2 to 4.6 | Pregame routine |
| Base running | 2 to 10 bursts | 8.5 to 12.8 | Steals, tags |
| Hard swings | 10 to 60 reps | 4.5 to 6.8 | Batting load |
| Bullpen | 8 to 45 min | 5.5 to 8.5 | Pitching work |
| Scenario | Time | Main Driver | Calorie Risk |
|---|---|---|---|
| Full game catcher | 140 min | Squat resets | Under-count |
| Starting pitcher | 155 min | Pitch count | Arm load |
| Showcase workout | 105 min | Sprints | High bursts |
| Adult rec game | 120 min | Rest ratio | Variable |
| Formula | Variables | Output | When Used |
|---|---|---|---|
| MET kcal | MET, kg, min | Calories | Main estimate |
| Field kcal | Position, innings | Field burn | Defense |
| Burst kcal | Runs, swings | Added burn | Actions |
| TDEE share | kcal, TDEE | Percent | Daily context |
💡Tips
Baseball’s a waiting game, most of us think. Jog out to your spot, stand around in the dirt, wait some more, then trudge back to the bench. If it wasn’t true, we wouldn’t of need to find ways to explain away that last slice of pizza after the game.
Turns out, we’re totally mistaken. The reality of baseball is that its metabolism lie in the blips, not the base level. Ninety seconds standing still for a shortstop doesn’t compare to the calories burned in three seconds while he sprints to catch a liner.
Why Baseball Burns More Calories Than You Think
That’s something the calculator above will figure for you, but it won’t tell you what those figures mean. To get there, you have to look more closely at just how much the game is changing. Movement isn’t constant. Generic fitness trackers pretend it are. Either you’re sitting down or you’re running. There’s no in-between. But baseball isn’t like that. It’s an extremely stop-and-go sport.
Your heart rate surge on a hard swing, then remains high when you try to steal a bag, then drops while you await the pitcher’s delivery. Because most apps don’t differentiate between time spent batting versus time spent running bases versus time spent fielding the ball, they miss out on game’s extreme stops and starts. If you want a real estimate of calories burned, you need a tool that differentiates between actions that produce the most caloric output. The more hard swings and plate appearances you input into the estimator, the more high-intensity output you capture, which a simple duration timer fail to account for. This is difference between a guess and a real estimate.
Your total burn depends hugely on position, hence the prompts asking where your main spot is. A catcher is essentially doing low-impact squat for two hours while tracking every pitch, but physical load is deceptive. It’s low impact. But it’s deceptive in terms of physical load because there are explosive throws to second base and constant resetting of the stance. And then there’s the mental load. As the reference table on the page explains, a catcher and his pitcher carry a higher metabolic equivalent than an outfielder who may only jog in to a deep ball once per twenty minutes.
For a pitcher, the direct tie between pitch count and calorie burn is key. Eighty isn’t as much of a workout as twenty-five, and the tool accounts for that volume instead of just staring at the clock.
Consider as well the dugout. That’s not “dead time,” but it’s also part of the session. The estimate has a place for rest ratio (perhaps unexpectedly), if you’re hoping to get maximum bang for your calorie buck. But there’s no getting around this one: When you’re sitting out half the game, your average expenditure will be lower. To neglect rest twists your nutrition plan, and exaggerates your results. That’s particulary relevant when you’re a recreational player or young athlete who may not play every single inning.
A doubleheader will extend the time frame, yet frequently dilute activity-per-minute. The math blends in those low-exertion intervals between, along with the high-intensity bursts, providing an accurate estimate of the day’s true metabolic equivalent. These numbers should inform hydration and fueling choices. Maybe you believe you burned four hundred calories during a casual league game, but according to the calculation, it was actualy six hundred due to an extensive bullpen session and five additional base-runs. That makes all the difference when it comes to recovery.
Fatigue results from under-eating. Under-eating result in slower reactions. Slower reactions result in injury. This is all part of a chain reaction that begins with bad information.
Baseball isn’t just about standing around. There is no need to track every single second of your life, though you must recognize its importance. It honors the anarchic nature of the sport. Use this approach for a regular Tuesday practice session instead of a showcase workout where you want to throw more or with more intensity. Adjust your throwing load or sprinting to match. The numbers will reflect the reality.
From then on out, stop estimating your effort by what the clock says. Measure it by what happens. When you realize how expensive those brief explosions are, you’re going to look at upcoming inning in an entirely different way.