Bar Speed Velocity Loss Calculator
Compare your fastest and slowest rep speeds, set a velocity-loss stop point, and estimate fatigue for the next set.
📌Presets
Each preset loads a realistic velocity-based training scenario and recalculates the stop threshold.
⚙Calculator
Velocity-loss snapshot
Enter fastest and slowest rep speeds to calculate fatigue.
📊Velocity Metrics
📑Reference Tables
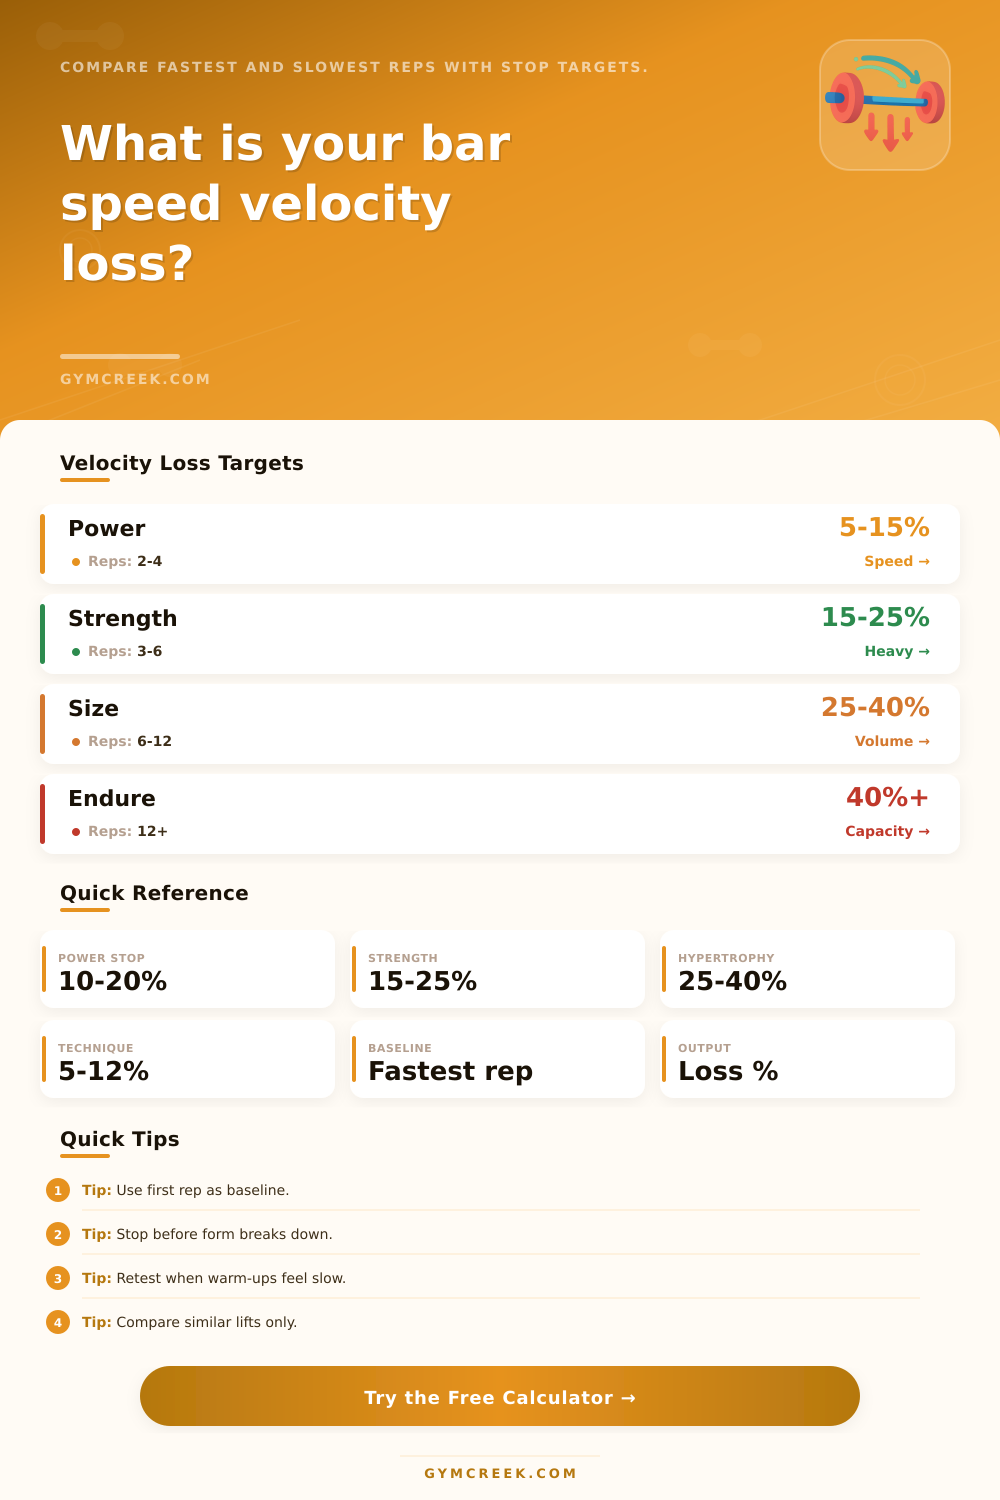
| Training Goal | Typical Loss | Set Character | Stop Signal |
|---|---|---|---|
| Technique quality | 5-12% | Very crisp reps | Stop early |
| Power speed | 10-20% | Fast concentric intent | Protect speed |
| Strength work | 15-25% | Heavy but repeatable | Stop near target |
| Hypertrophy volume | 25-40% | Useful fatigue | Stop before grind |
| Strength endurance | 40-50% | High fatigue sets | Use sparingly |
| Lift | Fast Rep Range | Loss Sensitivity | Note |
|---|---|---|---|
| Bench press | 0.35-0.75 m/s | Moderate | Stable setup helps readings |
| Back squat | 0.30-0.80 m/s | Moderate | Depth changes can skew speed |
| Deadlift | 0.25-0.65 m/s | High | First rep may be slower |
| Overhead press | 0.25-0.70 m/s | High | Small losses matter quickly |
| Olympic pull | 0.80-1.60 m/s | Very high | Power drops before fatigue feels high |
| Measurement | Confidence | Adjustment | Best Use |
|---|---|---|---|
| Linear encoder | High | 0% | Primary testing |
| Camera app | Medium | +3% | Consistent side angle |
| Wearable sensor | Medium | +2% | Team tracking |
| Manual estimate | Low | +6% | Rough session notes |
| Result Zone | Below Target | At Target | Above Target |
|---|---|---|---|
| Power | Add reps carefully | Stop or repeat | Reduce load |
| Strength | Keep load | Hold next set | Drop 2-5% |
| Hypertrophy | Add 1-2 reps | Good fatigue | Rest longer |
| Technique | Practice quality | Stop clean | End the set |
💡Tips
Even if you feel like you’ve got some gas left in the tank, you might see that the bar slows down. It’s not because you’re tapped out. It’s just lost velocity. When this happens, velocity loss tracking are a practical training tool.
Once you input your slowest and fastest rep speed into the calculator above, it will do all of the math for you. That way, you don’t have to guess at how fatigued you are.
How to Use Velocity Loss Tracking
Strength is not just a matter of lifting something. Speed is the sign of quality. And most folks only care about what they’re lifting. They don’t consider speed at which they’re lifting it. If you have intent in the lift, then even a heavy object move quick. But if you let that speed dip significanty below where you’re best, then you’ve crossed from productive stress into junk volume.
The tool allows you to see precisely when this occurs. Then you can halt the lift before you start compromising your form/recovery.
That brings us back to the inputs. It is more important than you think. First, establish your real world baseline velocity, which is speed on your very first clean rep in each set. It is not a bounce rep and certainly not one where you had to cheat momentum to get up there. Because if you have an inflated baseline, everything after it are going to be off.
Now take your slowest successful rep and enter both speeds into the calculator. The number between those two represent how much energy you burned to get the reps done. That number has a very different meaning in context.
For example: For hypertrophy work, it’s okay to lose 20% of your velocity because that little bit of fatigue create some muscle building stimulus. But for power development, where we’re training our nervous system to fire quickly, losing 20% is disastrous. The page clearly lays it out in the reference tables, aligning goals with acceptable loss thresholds. Chase size? Push deeper. Train for speed? Stop early. Select your goal and the calculator will act accordingly. This also makes sure the feedback lines up with your actual goal (rather than using a one-size-fits-all rule).
The other variable that changes the window is athlete experience level. For novices, there’s typically a wider swing in speed as they’re still figuring out how to distribute their efforts. Elite lifters may have narrower margins because they tend to operate at or near their physiological limits most of the time. Choosing the appropriate level allows the tool to determine whether or not you’re being strict enough. It does not need to be perfect, just an honest look at what you are currenty capable of doing.
There is also variables from technology. Precision devices provide precise information. Manual guesses (and phone apps) has some error. To account for that, the calculator has different confidence levels depending on how precisely you can measure. That’s important. Your high-tech sensor might say stop at a twenty percent loss, but you may eyeball it and think that you should of push on. This happens even when data isn’t good enough to believe either way. Believing poor data will do more harm then believing no data.
These numbers also take into account the silent factor of rest. When you don’t give yourself enough time to recover between sets, your subsequent set begin at a lower baseline (especially after crushing a set with heavy velocity loss). Based off how hard you push, it tells you when to rest and what loads to adjust accordingly. It’s a closed loop system, your session stays consistent. You’re not lifting randomly; you’re managing energy use throughout the whole workout.
To conclude. Again, it’s not about hitting some number “because we need a data point.” The goal is getting rid of your emotional attachment to finishing the set. Even if the bar feels like it’s crawling, ego says to go ahead and get it done anyway. But data lets you know: “Yeah, I’ve given you enough; any more work here will be digging yourself out of a recovery hole.”
Find that sweet spot where you’re putting in real work versus wasted motion. Then once you have a visible drop, you can respect the limit without fighting it. And as a result, you’ll come out the other side stronger, not because you lifted more weight, but because you stopped when it mattered.