Acute Chronic Workload Ratio Calculator
Compare a 7-day acute load against a 28-day chronic baseline, switch between rolling and EWMA views, and adjust the action call for session count, spike threshold, sport, load type, and readiness.
📌Presets
Presets use realistic training-load shapes, not fixed advice. Change the threshold and readiness score to match your monitoring system.
⚙Calculator Inputs
Workload ratio snapshot
Enter a 7-day load, 28-day load, and readiness score to calculate the current spike signal.
📊Metrics Grid
📑Reference Tables
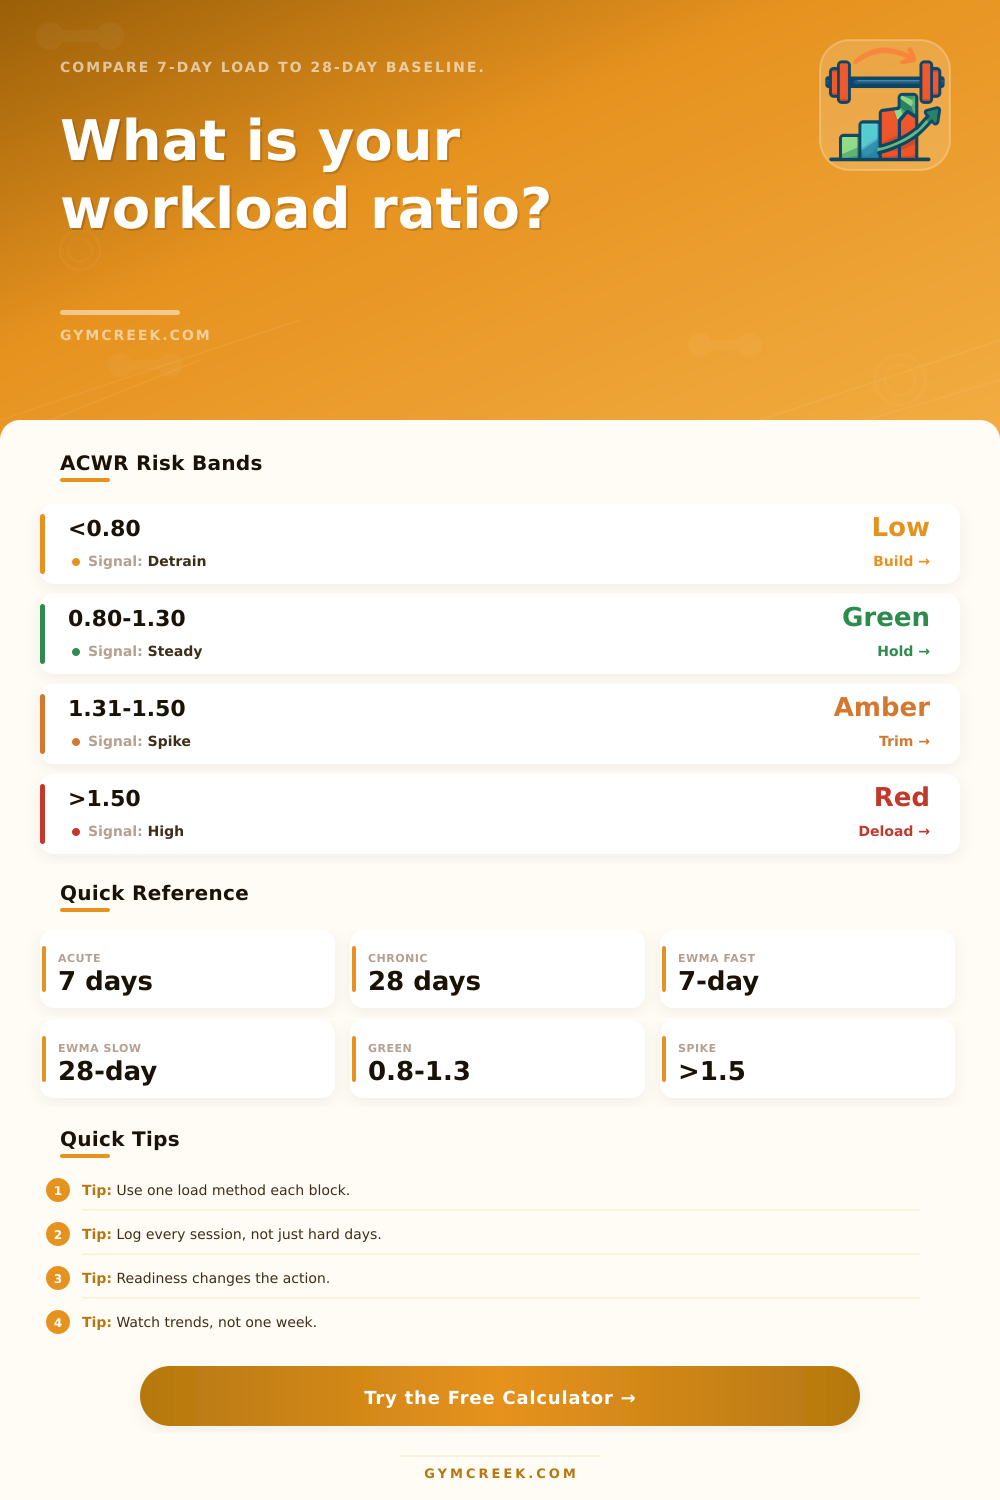
| Ratio | Band | Typical Signal | Training Call |
|---|---|---|---|
| <0.80 | Low | Possible underload | Build gradually |
| 0.80-1.30 | Green | Stable exposure | Hold plan |
| 1.31-1.50 | Amber | Noticeable spike | Trim volume |
| >1.50 | Red | High spike | Deload or split |
| Method | Acute Term | Chronic Term | Best Use |
|---|---|---|---|
| Rolling | 7-day total | 28-day weekly avg | Simple review |
| EWMA | Fast smoothing | Slow smoothing | Trend checks |
| Session count | Load density | Recovery spacing | Week design |
| Readiness | Subjective score | Context modifier | Daily call |
| Sport | Common Load | Watch First | Notes |
|---|---|---|---|
| Field sport | sRPE / GPS | Sprints | Match weeks |
| Running | Miles / TRIMP | Long run | Surfaces |
| Gym | Tonnage / RPE | Heavy day | Joint stress |
| Cycling | TSS | Intensity | Back-to-back |
| Readiness | Meaning | Ratio Bias | Decision |
|---|---|---|---|
| 8-10 | Fresh | Normal | Proceed |
| 6-7 | Okay | Watch | Keep flexible |
| 4-5 | Flat | Caution | Reduce spike |
| 1-3 | Poor | High caution | Deload |
💡Tips
At the heart of smart training is a comparison of recent and long-term workload that converts raw effort into a number you can actualy read: how does this week’s effort stack up against what you’ve done for the last month? Put in your week’s worth of sessions, then plug it in and see if the number says you’re fitting your current fitness level, or starting to run ahead of yourself.
That simple comparison help keep both athlete and coach from guessing about whether a hard block will be useful or simply risky. That’s why ratio is effective. Your body becomes accustomed to chronic exposure; four weeks of moderate running, lifting, or field sessions establishes a baseline for how much stress your nervous system and tissues has already absorbed. Then those final seven days serve as a measure of where you’ve landed on the spectrum. Whether you’re still within the window or outside of it.
How to Use Training Ratios Safely
If the new workload remains near the old baseline, recovery typicaly catches up. It gets ahead when the new workload rise significantly above the old. The most important thing is to pick a single method for measuring your load and stick with it. You can rate your session on perceived exertion, record total tonnage, or count total distance. Or, calculate your training stress score.
Whatever you do, make sure it’s the same each week. Comparing a week rated by perceived effort to a week where you recorded distance will hide the actual trend and ruin comparison. Once you input those totals into the calculator above, it’ll do the math for you. But what makes this valuable isn’t the math, it’s the discipline of logging each and every workout (not just the tough ones).
There is another factor the ratio doesn’t capture: are you ready? Even if the numbers seems within reason, you might have less tolerance due to sleep, soreness, life stress, or traveling. The same ratio will feel more cautious on a flat day then it does on a sharp day. That’s why many systems uses both a simple check-in each day and the ratio. Lower readiness scores shifts the practical recommendation towards caution.
But again, don’t fall into the trap of believing you’ve heard the last word during any given week. A high ratio after a planned heavy week might just be part of the plan. However, that same number after an unplanned increase in volume could of mean trouble. One dramatic reading doesn’t provide as clear a signal as do trends across multiple weeks.
This is where longer baseline comes into play. It smoothes out the noise caused by a hard session or an unexpected rest day. And then there’s use of the ratio itself: I’d say it also includes monitoring where the workload falls on the week. Even if the weekly percentage isn’t high, one or two hard sessions can cause a bump if they total over a third of the week. In contrast, evenly spaced hard days with recovery day in between will be safer for the same workload.
Enter both your session number and toughest individual day into the calculator and it’ll flag the spike. But more important than any calculation output is getting into the habit of observing the week’s shape. Over time the ratio becomes less of a strict rule and evolves into a lingua franca between athlete and coach. It is a place where both can begin discussing whether to push and when to pull back. And it’s not a replacement for judgment, ever, but removes the piece of the equation that previously relied purely based off gut feel or memory.