40 Yard Dash Calculator
Adjust a 40 time for timing method, surface, wind, and start quality, then estimate acceleration, flying speed, average speed, and speed score.
📌Presets
Each preset loads realistic split times, body size, timing method, and conditions so the result cards update immediately.
⚙Calculator
40 yard dash snapshot
Enter a valid 10, 20, and 40 yard time to calculate split-based sprint metrics.
📊Sprint Metrics Grid
📑Reference Tables
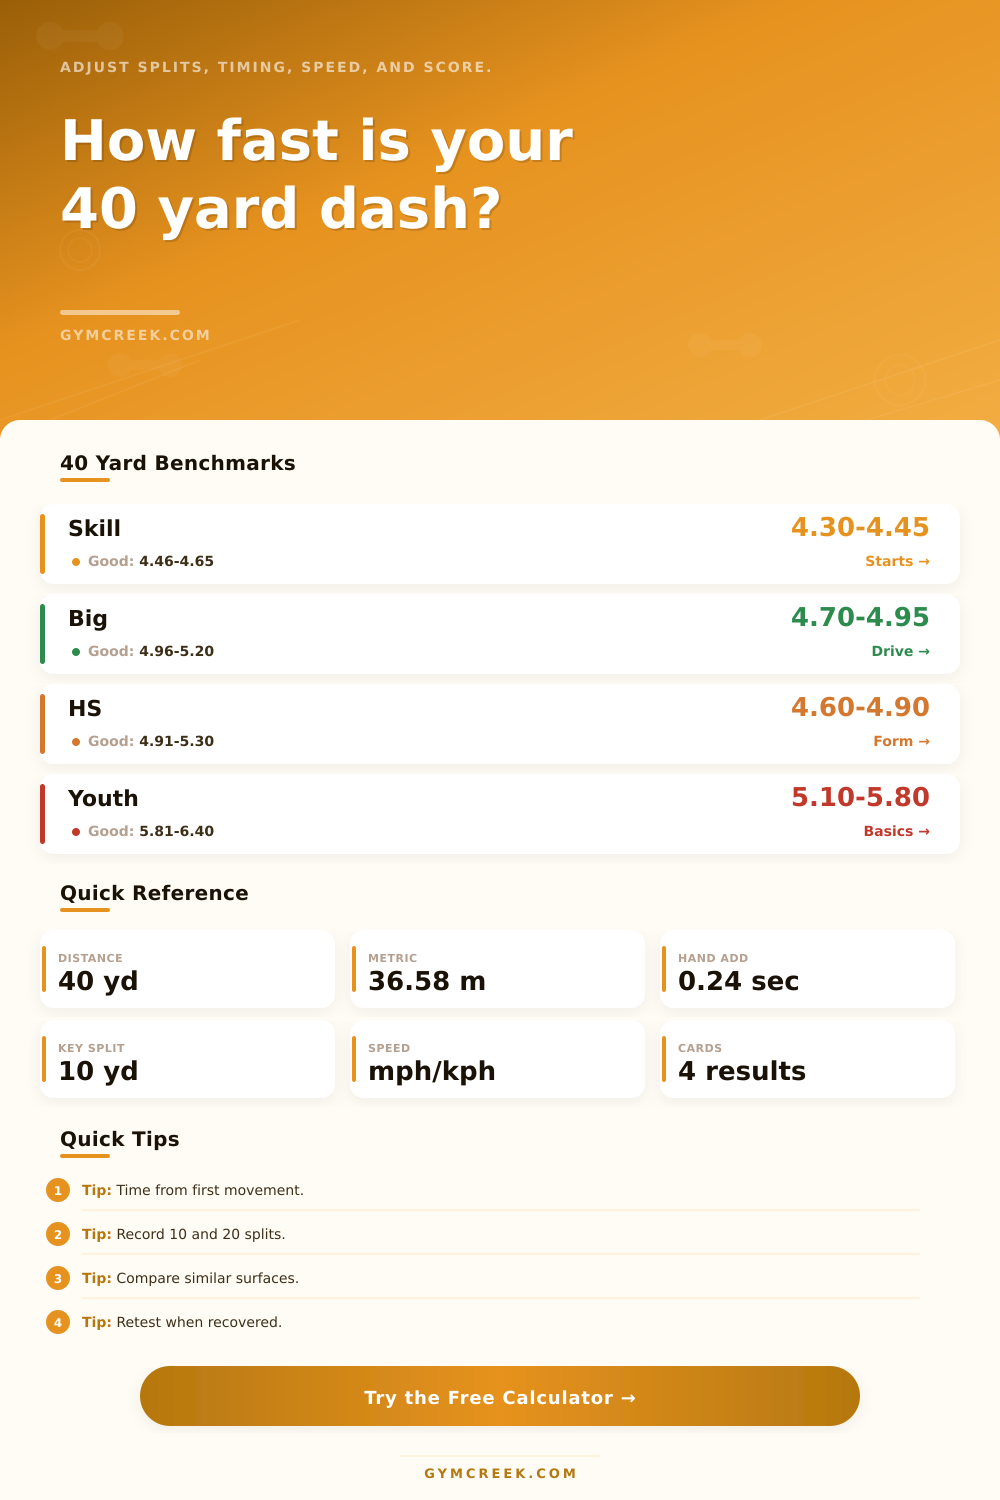
| Group | Elite Range | Competitive Range | Usually Needs |
|---|---|---|---|
| Football skill | 4.30–4.45 sec | 4.46–4.65 sec | Start consistency |
| Big skill | 4.50–4.70 sec | 4.71–4.95 sec | Transition speed |
| Lineman | 4.85–5.10 sec | 5.11–5.45 sec | First 10 yards |
| High school varsity | 4.55–4.85 sec | 4.86–5.30 sec | Mechanics and timing |
| Split | What It Shows | Fast Marker | Training Clue |
|---|---|---|---|
| 0–10 yd | Start and drive | 1.45–1.60 sec | Push angle, shin angle |
| 10–20 yd | Acceleration rhythm | 0.95–1.10 sec | Stride projection |
| 20–40 yd | Max velocity blend | 1.80–2.05 sec | Relaxation and posture |
| Flying 20 yd | Top-end speed | 20+ mph | Front-side mechanics |
| Timing Method | Calculator Add | Best Use | Caution |
|---|---|---|---|
| FAT / electronic | 0.00 sec | Official comparison | Needs proper setup |
| Laser gate / video | 0.05 sec | Training groups | Start trigger varies |
| Phone app / video | 0.10 sec | Practice estimates | Frame rate matters |
| Hand timed | 0.24 sec | Informal testing | Reaction bias is large |
| Formula | Variables | Result | Use |
|---|---|---|---|
| Average speed | 36.576 m / time | m/s, mph, kph | Overall sprint output |
| 0–10 accel | 2 × 9.144 / t² | m/s² | Start acceleration |
| Flying 20 speed | 18.288 m / split | mph or kph | Top-end estimate |
| Speed score | lb × 200 / t⁴ | Index score | Mass-adjusted speed |
💡Tips
Your 40-yard dash might be a four-point-five-second, but you ran slow off the line, or maybe your top end didn’t have much zip. Running fast is about more than just raw power. It’s usually timing and mechanics that make difference between a good sprint and a great one. Most folks think running faster is just about pushing harder. What makes you go faster are about applying force when the ground contacts you.
Plug in your splits and let the calculator do the math. You won’t have to guess about conversions and coefficients anymore. Let it break down what that final number mean for your training.
How to Run Faster
The first ten yards. This is straight-acceleration. This all depend upon how low you can get your angle of attack and how hard you drive into the ground. Too soon and you lose your momentum by standing up; too late and you don’t get to full speed. This first ten yard burst becomes a measure of acceleration for the tool. So if you see a quick ten yard split, that tells you you’re getting off to a good start. You’re creating force efficienty in the first few steps. If it’s high compared to the final time, then maybe you’re starting well but not transitioning properly. That is actualy a common issue for some of those bigger athletes. They have power but they lack the agility to switch into an upright sprinting posture fast enough.
Most sprinters lose their rhythm in the next chunk of the race (between ten and twenty yards, you’re transitioning from horizontal drive to vertical running). This is the most difficult mechanical phase to master. At the same time that you’re increasing both stride length and frequency, you need to change the angle of your body. That means changing gears, increasing speed without losing control. How well you make this transition determine the effectiveness of your run. Look at reference table on the page. It shows how various groups measure their mid-point splits. When you watch video from the side, a clean transition appears smooth, you’re being efficient with every movement. Choppy transitions waste energy as they fight your own momentum. Usually, it takes more practice different than strength training. If your head is bouncing or your shoulders are rotating, you are leaking force.
And then there’s those last twenty yards. Pure top speed here. Body relaxed, legs cycling fast. Tension kills speed. I’ve seen athletes who are grimacing and tensing their shoulders in that last stretch slows down. To isolate this top end velocity, the calculator takes out all influence of the start completely. That’s important because an athlete with elite top speed may be a slow starter. Knowing this will change your training. Is your flying split strong and your forty mediocre? Then you should of work on your starts. Is it weak? Work on relaxation and stride mechanics at high speed.
The numbers will change with conditions. How you use the tool changes the numbers. The type of surface and wind all affect it as well. Human reaction time is not consistent. That’s why hand timing has such notoriously inconsistent results. The tool accounts for that in the form of a built-in buffer. It also accounts for different surfaces. It’s like trying to run through wet cement compared to how much faster it is to run on a track or fast turf. A grass sprint timed by hand is like apples vs oranges compared to an electronic time on a track. The adjustment features makes sure you’re looking at your true speed potential versus the conditions of the day.
And lastly we have the speed score. Think of this as a measure that measures your speed based off your body mass vs. Time. So how fast are you for your size? Is your speed impressive or not? A bigger athlete running four-point-six is very different than a smaller athlete running four-point-six. The bigger guy has to move more mass but with equal velocity, that takes exponentially more power. The speed score gives you some sort of context that doesn’t come from just looking at a raw time. It helps put things in perspective and tells you where you stack up compared to others in your own weight class. Use it to see progress over time.
Small gains in the transitions and starts add up to huge gains in the end at the forty mark. Embrace the process. The time will take care of itself because the key is mastering the start and then the transition. And that’s how you win the race before you’ve even finished it.