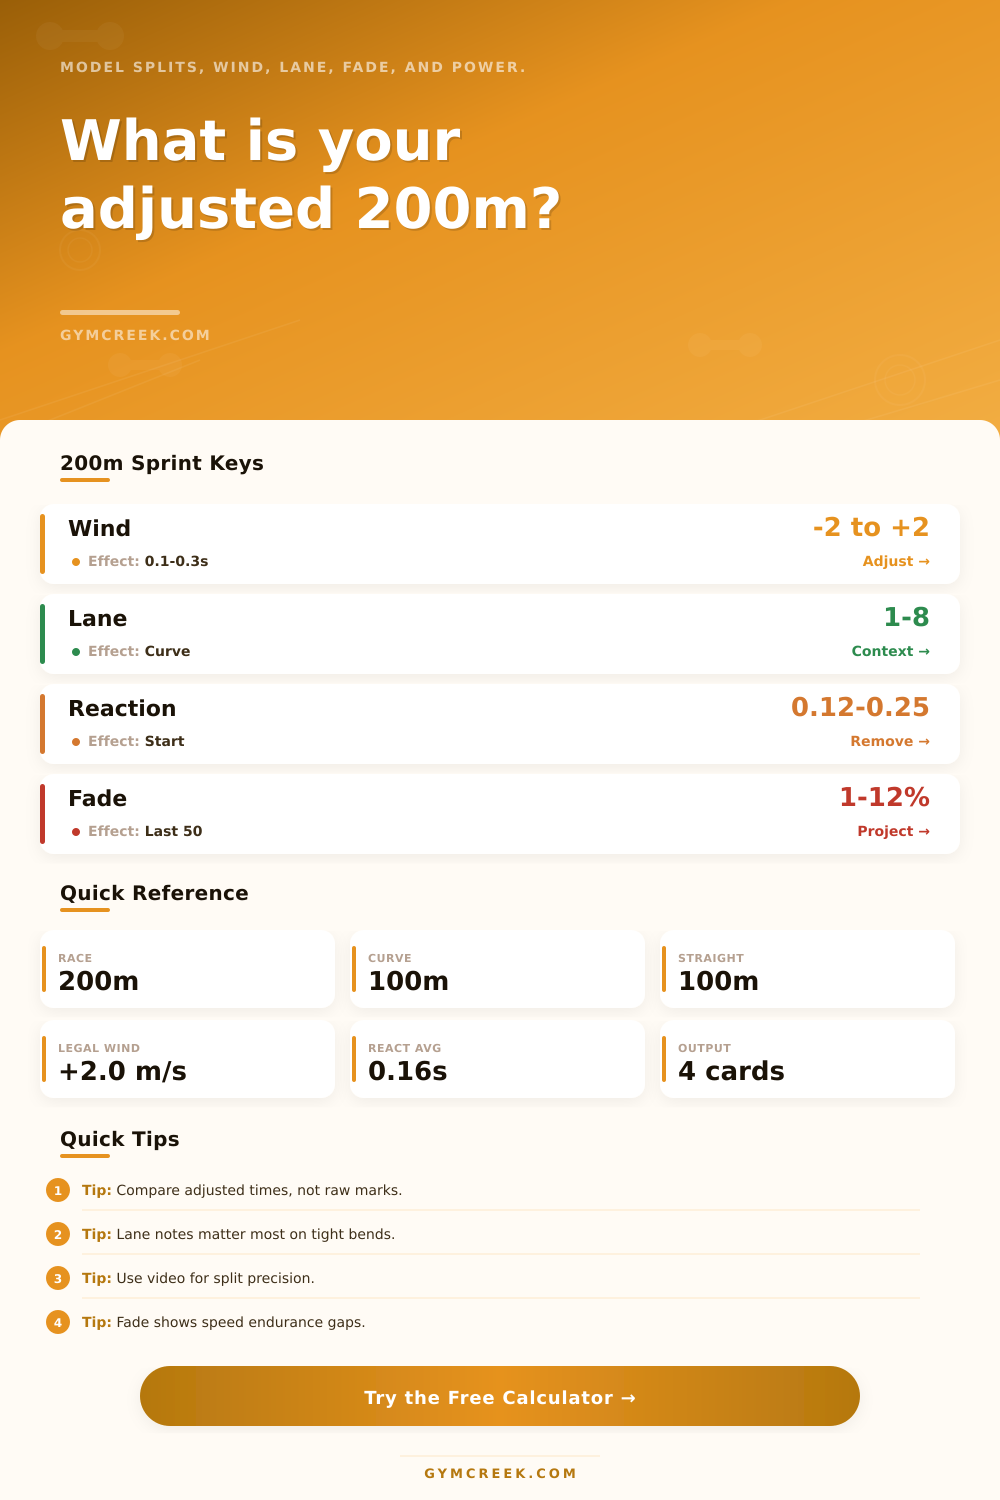
200m Sprint Calculator
Adjust a 200m mark for reaction, wind, lane, curve quality, and late-race fade while estimating splits, 100m equivalence, 400m potential, and sprint power.
📌Presets
Each preset loads a realistic race profile and recalculates the 200m model.
⚙Race Inputs
200m sprint snapshot
Enter race conditions to compare raw, adjusted, and projected sprint metrics.
📊Sprint Metrics Grid
📑Reference Tables
| Group | Developing | Competitive | Elite |
|---|---|---|---|
| Men | 25.0-28.5s | 21.5-24.9s | Sub 21.5s |
| Women | 28.0-32.5s | 24.0-27.9s | Sub 24.0s |
| Masters | 30.0-38.0s | 25.5-29.9s | Sub 25.5s |
| Youth | 27.0-34.0s | 23.0-26.9s | Sub 23.0s |
| Lane | Curve Feel | Typical Adjustment | Coaching Read |
|---|---|---|---|
| 1-2 | Tight bend | Add 0.04-0.10s | Needs curve skill |
| 3-4 | Neutral bend | Near zero | Good comparison |
| 5-6 | Open bend | Subtract 0.01-0.03s | Easier rhythm |
| 7-8 | Wide stagger | 0.00-0.02s | Run own race |
| Wind | Meaning | 200m Effect | Use In Model |
|---|---|---|---|
| -2.0 m/s | Strong headwind | About +0.10s | Credit athlete |
| -1.0 m/s | Headwind | About +0.05s | Small credit |
| +1.0 m/s | Tailwind | About -0.05s | Small debit |
| +2.0 m/s | Legal limit | About -0.10s | Normalize mark |
| Output | Formula Idea | Main Input | Best Use |
|---|---|---|---|
| Adj 200m | Raw plus corrections | Time, wind, lane | Compare races |
| 100m eq | 200m split ratio | Adj 200m, fade | Speed estimate |
| 400m pred | Double plus fade | Adj 200m, endurance | Event range |
| Power | Mass and velocity | Body mass, speed | Training context |
💡Tips
The calculator will help you break down what happened during your 200m dash. Breaking down the 200m race has always been tricky, it usually requires both the explosive power of a 100m sprint and the endurance of a 400m race at the exact same moment. You might think you ran well, only to look at the clock and see that your time wasn’t as fast then. There are several factors (lane position and wind) that we tend to overlook. The calculator takes care of these lane penalties and wind adjustments. It eliminates the guessing game and allows you to accurately compare performance.
How does this work? Well, wind matters a lot. But people don’t understand it. For record purposes, it’s limited to 2.0 m/s tailwind. But a slight breeze (0.5 m/s) can shave tenths off a time. A headwind makes it more difficult to run. Our tool will adjust your raw time so it’s set to a neutral baseline. So you’re able to contrast your results on a calm day with one that was windy. That level of normalization is what separates casual timing from serious athletic development.
Why Use the 200m Calculator
Your time will also be impacted by the geometry of the track. There’s a difference between running in Lane 1 versus Lane 7. You have to fight through a tight turn in Lane 1, leaning into a curve while using complex mechanics to keep up speed. It take time and energy. A lot of sprinters chalk up their slow time in Lane 1 as being due to poor fitness. They’re not; they’re fighting against physics. The amount of time a tight bend adds are shown in the reference tables. That gives perspective on what a slower time in an inner lane may mean, meaning the athlete had to work harder physically. It is a small detail but it makes a difference.
The last 50 meters is when most sprinters slow down during a race. Why? Fatigue causes them to be unable to sustain their top speed. Getting tired and being unable to keep up top speed is what we call fade. When you input your 100-meter split into the system, it calculates the amount of speed lost in the straightaway. High fade percentage means that you have strength in the ability to accelerate but are lacking in sustaining speed. That’s where you need to train and that’s what it points out. Drills don’t help if you slow down considerably in the back half of the race.
Based off your 200m performance, the tool will estimate what your 100m time would be. This helps you measure endurance against pure speed. Pure speed. If there’s a big difference between your projected 100m time and your actual 100m times, it means you don’t have as much top-end speed, even though you’ve got some endurance in you!
The tool uses your average speed and body mass to calculate your sprint power output. That’ll give you a benchmark against which you can track over the course of the season. That power number should rise as you get stronger. External factors may keep your race times consistent, but the power metric let you see how you’re progressing.
To use these metrics, however, means changing your mindset. Think about the clock like this: it’s diagnostic, but it shouldn’t be judgmental. Raw time is nothing more than a snapshot. Adjusted time is what matters. Train because you aren’t just trying to run faster; you are working to minimize the cost of the curve. You’re working to reduce the drag of the wind. You’re working to extend the length of your window of top speed.
Visible problems are easily fixed and most athletes gets better. Resting more, changing spikes, etc. Invisible problems are career changers. Speed can be hidden in a windy race. Inefficiency in a tight lane. Fade in the final 30 meters… You need to see that. The data is there, you just have to get it from the calculator.
Training creates change. Accepting adjustments requires looking at the data. Once you look at the data and accept the adjustments, then you can go out and run the truth.