1600m Run Score Calculator
Convert any 1600m, mile, 1500m, or custom run into pace splits, age-graded scoring, and realistic equivalent race times.
📌Presets
Presets load realistic time-trial profiles and immediately recalculate the normalized 1600m score.
⚙Calculator
1600m score snapshot
Enter a run time and calculate the normalized score.
📊Run Metrics Grid
📑Reference Tables
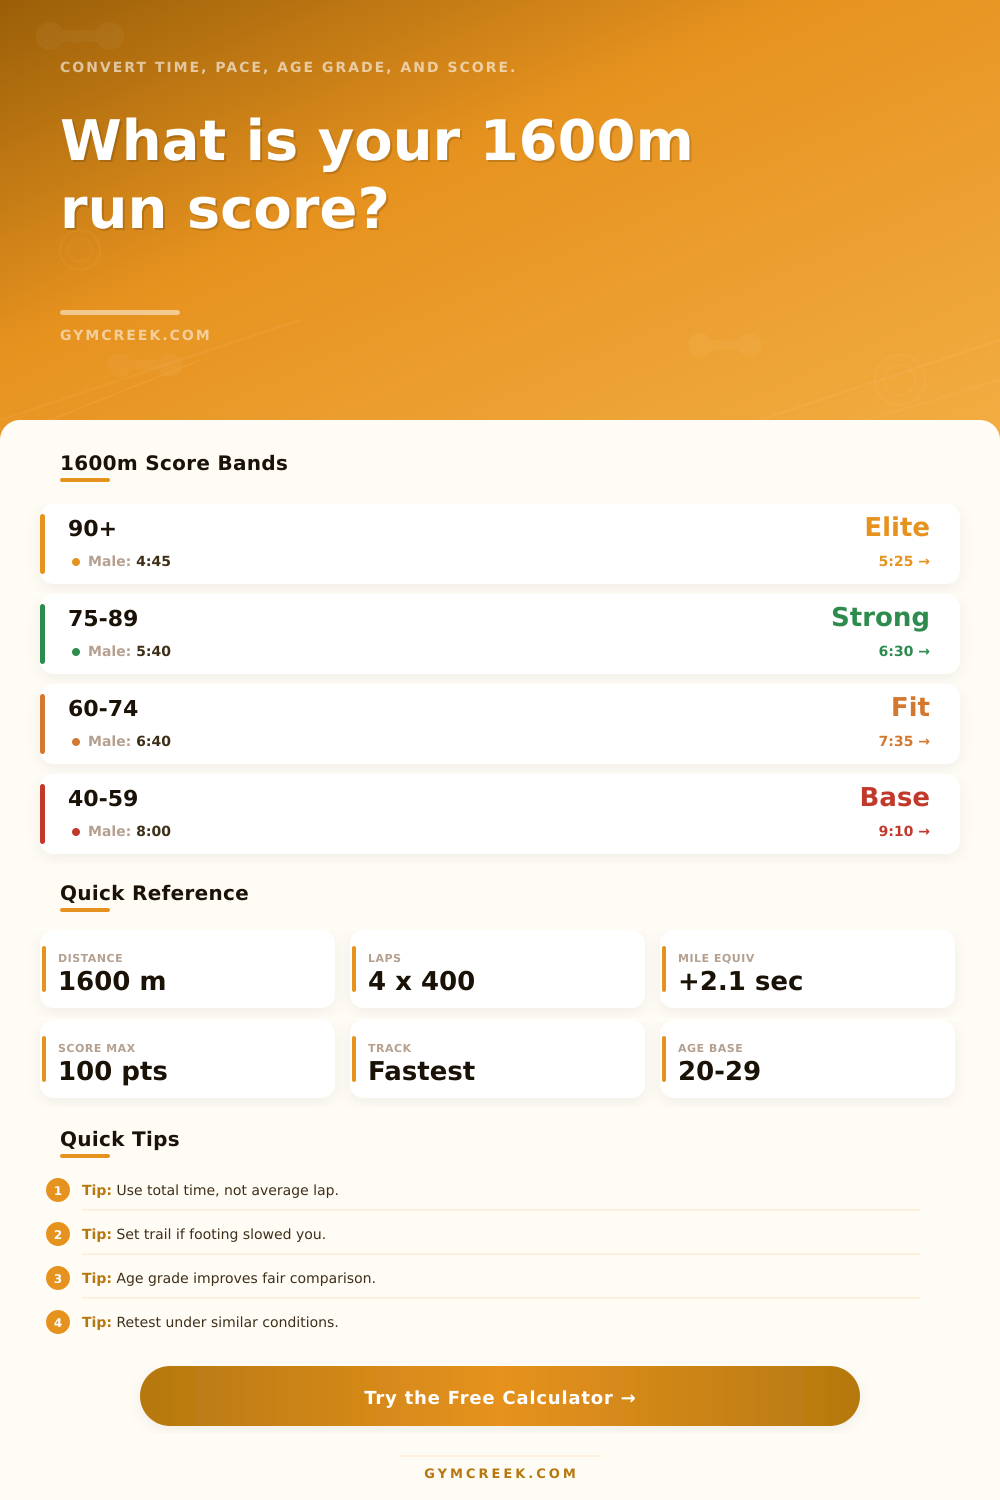
| Score | Band | Meaning | Next Focus |
|---|---|---|---|
| 90-100 | Elite | Race sharp | Specific speed |
| 75-89 | Strong | Competitive | Finish pace |
| 60-74 | Fit | Solid fitness | Aerobic base |
| 40-59 | Base | Developing | Consistency |
| 0-39 | Starter | Early stage | Easy volume |
| Group | Strong Male | Strong Female | Context |
|---|---|---|---|
| Middle school | 6:20 | 7:05 | Early racing |
| High school | 5:15 | 6:05 | Team scoring |
| Open adult | 5:30 | 6:25 | Fitness test |
| Masters 45 | 6:05 | 7:10 | Age adjusted |
| Masters 60 | 7:10 | 8:20 | Age adjusted |
| Distance | Conversion | Use | Note |
|---|---|---|---|
| 1500m | x 1.071 | Track marks | Riegel tuned |
| 1600m | x 1.000 | School tests | Exact base |
| 1 mile | x .994 | Road mile | Slightly long |
| 3200m | x .479 | Two-mile tests | Endurance bias |
| Formula | Variables | Output | Why It Matters |
|---|---|---|---|
| Riegel | Time, distance | 1600m equiv | Fair conversions |
| Pace split | Time, meters | 400m pace | Lap planning |
| Age curve | Age, sex | Score scale | Fair comparison |
| Condition factor | Surface, heat | Adj time | Context check |
💡Tips
You get ready, standing on the track preparing for what will be a seemingly endless four laps around. The starter pistol sounds and off you go, running as fast as you can without falling over dead for almost a full mile.
It’s hard because it asks for both anaerobic power and aerobic endurance, with nothing comfortabley in between (no mid-distance break). For most folks, this was the one distance they ran once in high school or at a fitness test and then forgot ever existed. They accept the last time as fact instead of taking it as a data point into their current condition.
How the Calculator Helps You Run Better
That’s where the calculator comes in. Just plug in your time, and it’ll do all the math for you. But what do those numbers mean? The number of seconds are actualy a big deal; they provide a true measure of your underlying fitness potential once you look past the raw time on the clock.
For example: A 1600 meter run is roughly equivalent to one mile plus a little extra distance, enough of a difference that elite runners notice and casual joggers ignore entirely. So the tool also takes into account surface conditions. Running on an uneven grass or a hard concrete floor cost you more energy than running on a synthetic track. It also accounts for altitude, the fact that the air is thinner up high, so your body has to work harder to produce the same amount of oxygen it would get easily at sea level. It does all this because it understands that these environmental factors are variables that need to be removed, leaving us with a truly accurate reading of our underlying fitness potential.
Where runners tend to trip themselves up is pacing: running with consistent effort instead of chasing a score band (with this exception). With the output, you get your adjusted pace per 400 meter lap and that’s like a reality check to the fast paces we try to hit at the starting line. It looks heroic for those first couple laps then becomes a battle for the last eight hundred meters because lactic acid has built up and your body hasn’t been able to clear it quickly enough.
The score bands in the reference section give you context for where you fall compared to a typical age group, from the elite all the way down to base fitness categories. That’s neither bragging nor shaming, just having an exact idea of what kind of training adjustment will take you from one bracket to another. But even beyond the time comparison, there’s another dimension of fairness that age grading brings. Both a twenty year old runner and a fifty five year old could clock an identical six minute 1600 meter run, but it would represent wildly different percentage outputs of their respective physiological maxes. Age-grading puts all those efforts through a standardized curve to create normal comparisons. You can compare yourself to other runners your same age or look across history to see where you stack up.
Additionally, it predicts what your comparable five kilometer time should be (based off the same kind of formulas used by projection models). This is a helpful way to measure yourself when pursuing long-distance goals. There is no need to actually run three whole miles each time to get that number!
This kind of training takes some patience: Speed develops quickly but fades if you don’t maintain it properly. Aerobic capacity take longer to develop, and there’s no way to cram fitness into a weekend like you could of cram muscle mass into a week of lifting. That’s where the calculator comes in. It gives you something consistent to measure. You can use it to track small improvements month-by-month to see if all that extra volume turns into speed instead of just leaving you exhausted.
It’s tempting to get carried away with the score, but the true benefit is the long-game, how the steady application of consistency begins to outperform the random spikes of maximum effort. Running 1600 meters isn’t so much a battle against time as it is mastering your inefficiency with discomfort. The goal posts, the numbers; provide you with purpose and a framework. It’s that silent consistency of mile after mile and week after week. It is also the diligent down time that does the heavy lifting.
When you start to see the ticking clock as feedback instead of an enemy, and when you learn to master both your pace and how efficiently you pay that price, running four laps suddenly doesn’t feel like such a struggle. It becomes something you can control.