100 Yard Dash Calculator
Convert a 100 yard sprint into useful race metrics: adjusted time, 10/40/60 yard splits, average speed, 100m equivalent, wind and surface correction, and sprint power.
📌Presets
Presets load complete sprint profiles with race time, 10/40/60 yard splits, reaction time, wind, surface, and bodyweight.
⚙Calculator
100 yard dash snapshot
Enter race time and splits to calculate adjusted sprint metrics.
📊Metrics Grid
📑Reference Tables
| Level | 100 yd | 40 yd | 60 yd |
|---|---|---|---|
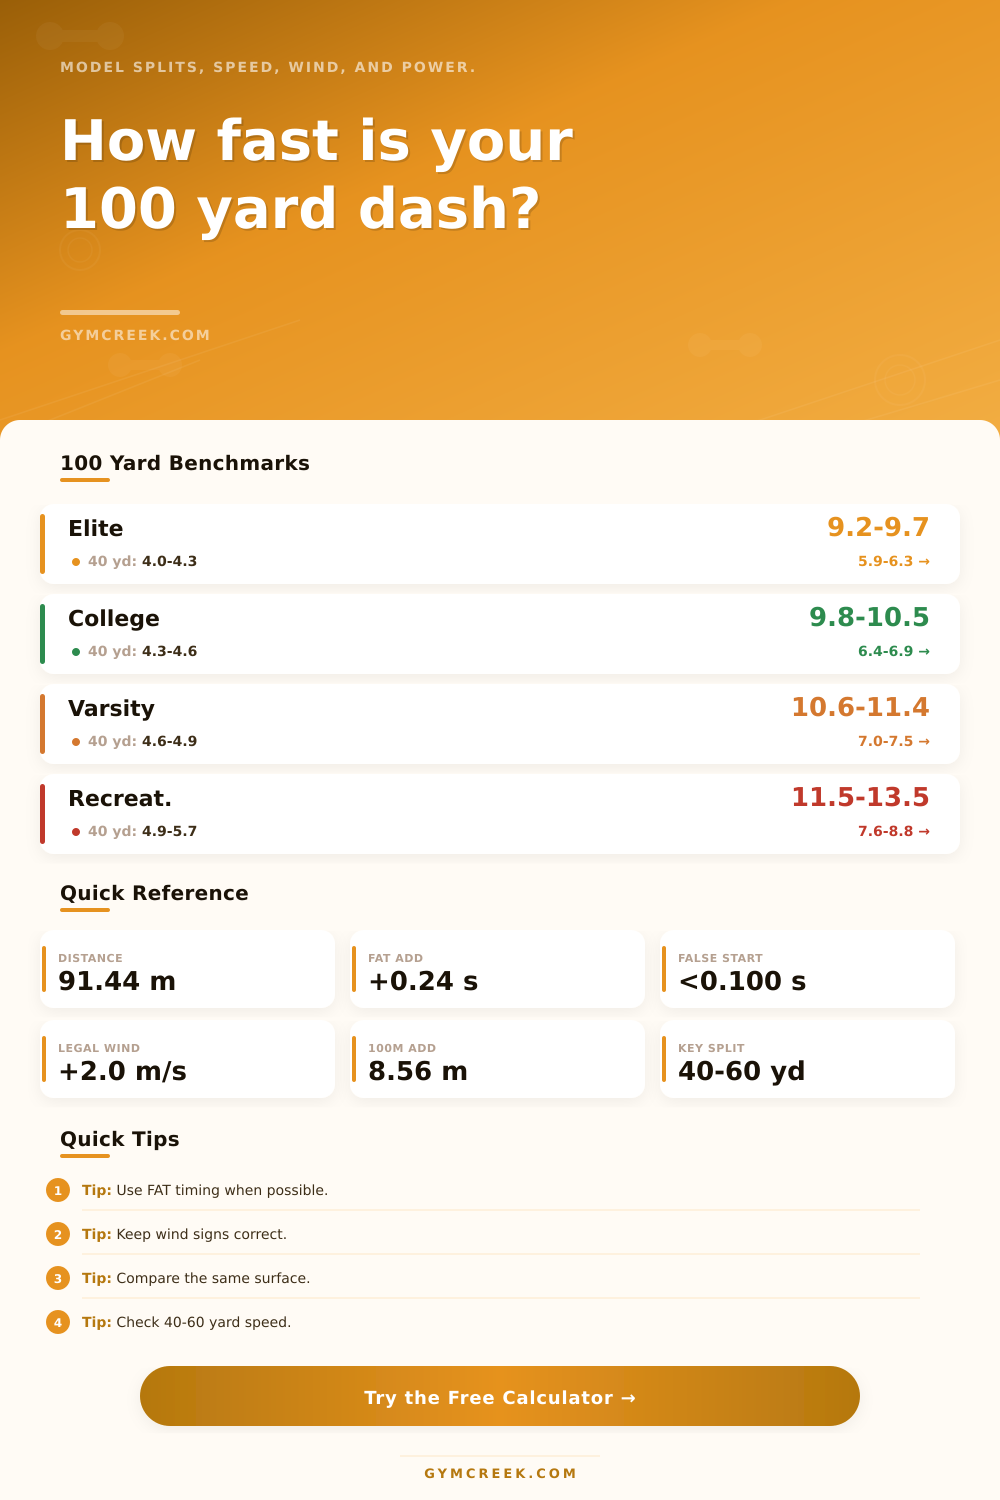
| Elite sprinter | 9.2-9.7 s | 4.0-4.3 s | 5.9-6.3 s |
| College sprinter | 9.8-10.5 s | 4.3-4.6 s | 6.4-6.9 s |
| High school varsity | 10.6-11.4 s | 4.6-4.9 s | 7.0-7.5 s |
| Recreational fast | 11.5-13.5 s | 4.9-5.7 s | 7.6-8.8 s |
| Adjustment | Input | Effect | Use |
|---|---|---|---|
| Hand timing | Hand time | Add 0.24 s | FAT comparison |
| Tailwind | + m/s | Add small time | Neutral estimate |
| Headwind | - m/s | Remove penalty | Neutral estimate |
| Slow surface | Grass/dirt | Subtract penalty | Track equivalent |
| Segment | Distance | What It Shows | Watch |
|---|---|---|---|
| 0-10 yd | 9.14 m | Reaction and push | Low heel recovery |
| 10-40 yd | 27.43 m | Acceleration build | Posture rise |
| 40-60 yd | 18.29 m | Top speed entry | Relaxed rhythm |
| 60-100 yd | 36.58 m | Speed endurance | Holding mechanics |
| Formula | Variables | Output | Note |
|---|---|---|---|
| Average speed | 91.44 m / time | m/s, mph | Whole race pace |
| 100m estimate | Final split speed | Seconds | Adds final 8.56 m |
| Power index | Mass, distance, time | Watts | Comparison only |
| Surface standard | Time, surface | Track estimate | Best for repeats |
💡Tips
Sprints are simple; it’s comforting. You get to starting line. A gun goes off. Run like hell for ninety-one point four four meters. That’s all. Nine-one-point-four-four-meters. Nothing more than spikes and a track, a raw test of speed and strength.
But the simplicity hides something else: it never tells full story of what happened when you were running the race. The time on the clock isn’t the story, not always. It’s merely the headline. For the rest, there are the split times, the wind that helped push you along or held you back, and kind of surface you ran on. Most athlete will look at their watch and they’ll only see one thing. They’ll see a number. Good ones knows how to see the profile.
How to Understand Your Sprint Times
After plugging in your splits and total race time, the calculator do all the heavy lifting for you. You won’t need to guess with conversions and coefficients. It will take the raw chaos from your race and boil it down into comparable metrics. All you have to do is enter your total time, your reaction, and your splits at the ten yard, forty yard and sixty yard marks.
Why those three distances? Those are distinct phases of sprinting. Your first ten yards tell you something about your start. Are you standing up too soon? Are you driving out of blocks with purpose? Whatever it is, that early acceleration is difficult to build back later. It’s a habit of applying force. A forty yard split is a critical crossover point. It bridges the gap between football speed test and track sprinting. If you’re a multisport athlete, that number matter more then the finish line. A sixty yard split shows you how well you can transition into maximum speed. It’s the moment when you stop accelerating and hold speed.
Sprinting is all about context. You don’t run the same way on a synthetic track as you do on grass field. That’s accounted for here; running on a surface that absorbs some of your energy is compared against a synthetic baseline. It further takes into account wind. Tailwinds of up to +2 meters per second are allowed in record books, but even a slight breeze can shave tenths off your clock. If it was windy when you ran, the calculator strips out that penalty and shows what your time might of been if it were a neutral day. That’s helpful for assessment: now you’re able to compare your performances across different condition without having to filter out the environmental variance.
Another stumbling block is converting yards into meters. Eight point five six meters is how much longer a hundred-meter sprint is then a hundred-yard dash. Because acceleration isn’t linear, you can’t just tack on a set number of seconds to your time. Instead, the device look at your speed during the latter part of your race and estimates what your hundred meter-equivalent would be. It assumes that if you were able to sustain this speed throughout the additional distance, then that’s what your hundred-meter equivalent would be. A moddern model, yes. Not a guarantee. But a far better guess than assuming a flat ratio. It takes into account physics of speed endurance.
Sprints is won and lost in the last forty yards. That’s when form breaks down and lactic acid begins to build up. Maintaining your form while tired are a separate skill from running at your top speed.
The second metric that tends to get ignored is power output. Based off how long you take and your bodyweight, the calculator estimate your wattage; i.e., your power output in watts while sprinting. This provides a ballpark figure for how much raw force you’re producing. It’s not a complete representation of your athletic value but can serve as a helpful benchmark when comparing with strength training efforts. For instance, if you have more power but less speed, either your technique isn’t efficient or you are simply too heavy. Conversely, maybe your speed is higher but your power output are lower. Perhaps you don’t have the strength to drive into ground. Force and velocity are at the center of sprint performance.
Don’t lose yourself in the decimals. This isn’t about memorizing benchmarks; it’s about knowing where you’re at. Log your splits and track them over time. Observe changes in your reactions. Note your speed endurance. The numbers aren’t there to define your worth; they’re there to guide your training. Remember when you step back up to the line: The clock only tells part of the story. The splits speak truth.