Zone 2 Power Calculator
Estimate aerobic cycling power from FTP, critical power, LT1, durability, cardiac drift, body size, and ride duration.
📌Presets
Presets model common rider profiles and recalculate Zone 2 watts, endurance ceiling, and drift guidance immediately.
⚙Calculator
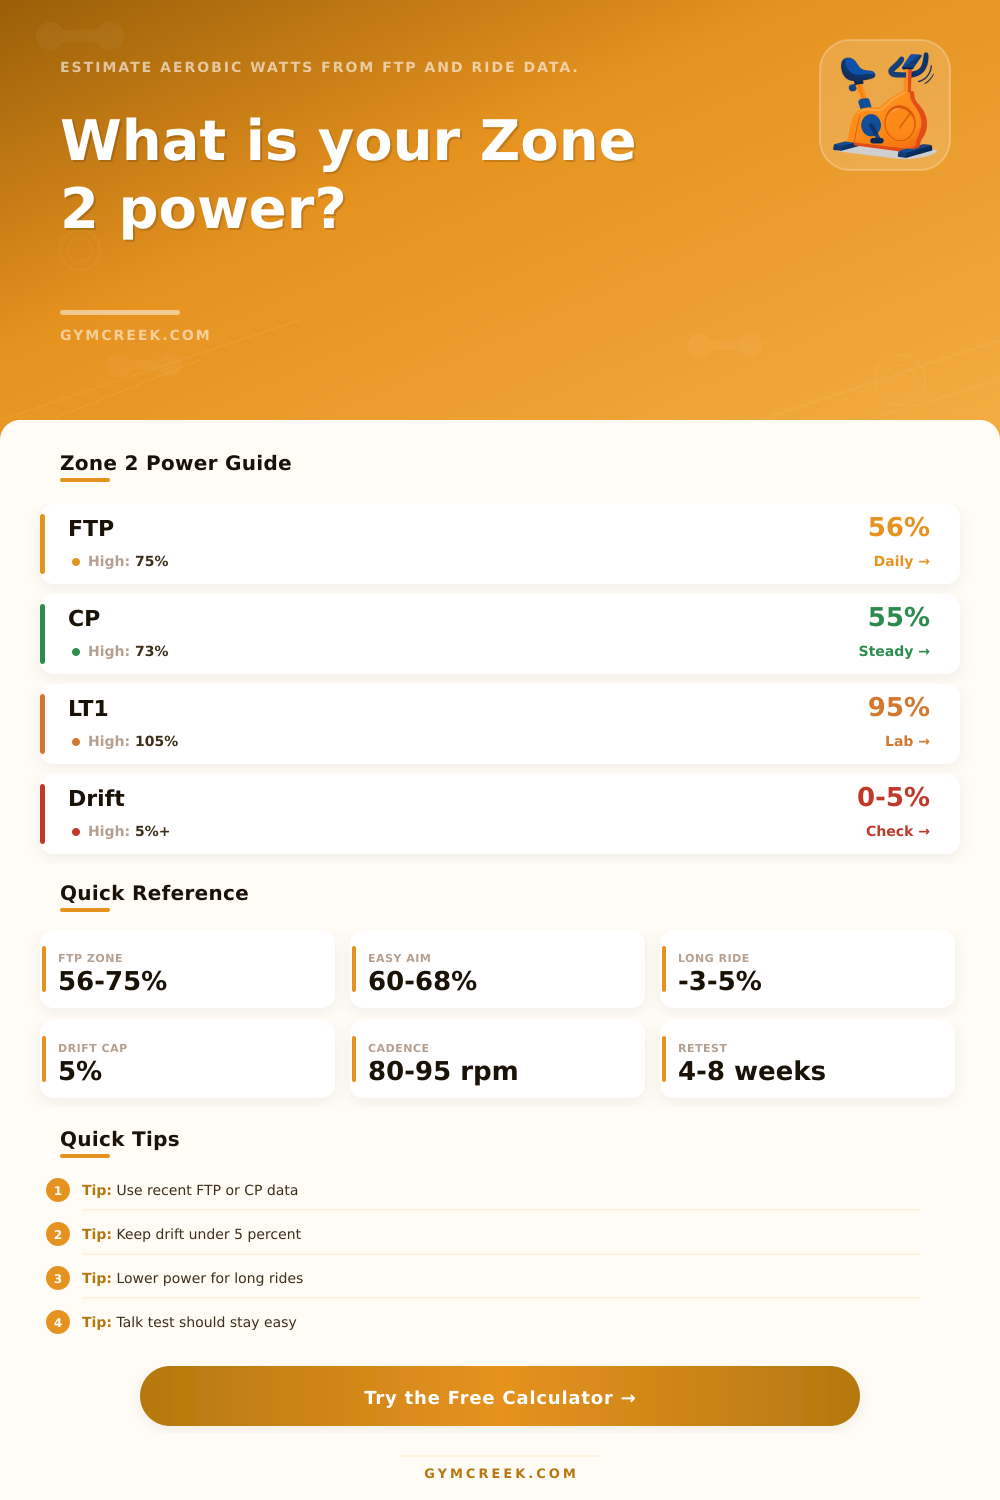
Zone 2 power snapshot
Enter current power data to estimate an aerobic wattage range.
📊Training Metrics
📑Reference Tables
| Model | Zone 2 basis | Best use | Watch point |
|---|---|---|---|
| Coggan FTP zones | 56-75% of FTP | Daily training plans | Upper end can feel tempo |
| Critical power model | 55-73% of CP | Power-duration testing | CP may sit above FTP |
| LT1 or AeT power | About 95-105% of LT1 | Lab or field validation | Needs good test data |
| Hybrid endurance cap | FTP plus drift check | Long steady rides | Adjust for durability |
| Signal | Green range | Yellow range | Interpretation |
|---|---|---|---|
| Cardiac drift | 0-5% | 5-8% | Lower target if drift rises |
| Talk test | Full sentences | Short phrases | Breathing should stay easy |
| RPE | 2-4 / 10 | 5 / 10 | Higher feels too hard |
| Cadence | 80-95 rpm | Under 75 | Low cadence adds torque |
| Ride length | Power adjustment | Reason | Use case |
|---|---|---|---|
| 20-60 min | No change | Short aerobic session | Lunch trainer ride |
| 60-120 min | Small check | Drift begins to matter | Normal base ride |
| 120-240 min | Lower ceiling | Durability matters | Long endurance ride |
| 240+ min | Conservative cap | Fueling and fatigue | All-day aerobic work |
| Formula | Input | Output | Use |
|---|---|---|---|
| FTP percent | FTP watts | Zone 2 watts | Main power range |
| Intensity factor | Power / FTP | IF score | Training stress context |
| Mechanical work | Watts and time | kJ and kcal | Ride-energy context |
| Mifflin-St Jeor | Age, sex, size | BMR | Daily-energy context |
💡Tips
Zone 2 training is a method of performing exercises with a specific intensity of effort. Zone 2 training are used to build an aerobic engine that will allow an individual to perform longer efforts with power in the future. For many individuals, zone 2 training can be dificult to quantify.
Coaches may use different metrics to indicate the power of an individual’s zone 2 training. Metrics may include a functional threshold power tests, a critical power model, or a lactate threshold test. Due to these different metrics, the terrain of a training zone, and the duration of that training zone, an individual can utilize a zone 2 power calculator to ensure that each individual finds there correct zone 2 power range.
How to Use a Zone 2 Power Calculator
A zone 2 power calculator may take the individual’s power anchor, which may be a functional threshold power test or critical power model, and apply several adjustment to that initial power. The zone 2 power calculator may ask the individual about the length of their ride, their cardiac drift, their terrain, and their body weight. An individual’s cardiac drift is the increase to their heart rate while power remains constant.
The longer an individual ride, the more likely their body will begin to fatigue and recruit type two muscle fibers. A higher heart rate mean more effort for the same power output. An individual may also have to account for terrain in their zone 2 power calculator.
If an individual is undertaking a long ride that include hills or gravel, they will have to lower their zone 2 power so that their ride doesnt become a tempo ride. Beyond power, there are other factor that an individual undertaking a zone 2 ride must consider. Zone 2 is a band of effort rather than a specific intensity.
Zone 2 is desined to allow an individual to utilize aerobic metabolism as their dominant form of energy. Additionally, zone 2 is implemented as a training method to increase the fat oxidation of an individual, as well as to increase the capillary density of an individual. During long rides, an individual may experience cardiac drift.
If an individual experiences a cardiac drift of five or six percent, they are approaching the edge of zone 2. An individual’s zone 2 power calculator must account for this and lower the target power to ensure that an individual remains within their aerobic zone. Aside from cardiac drift, body weight plays a roll in an individual’s determination of zone 2 training power.
An individual that weighs more will be able to produce the same watts as an individual that weighs less. However, the individual that weighs more will have a lower relative strength; they will be producing the same power but with a higher relative muscular effort. The zone 2 power calculator can quantify these differences.
Additionally, the zone 2 power calculator may also use an individual’s resting heart rate. An individual’s resting heart rate when at rest may provide information regarding their bodys recovery state. For instance, if their resting heart rate is five or six beats per minute above their normal resting heart rate, it is possible that their body is still clearing the fatigue from a prior ride.
In this case, the individual should of choose the lower portion of the power range provided by their zone 2 power calculator so that their body does not fatigue during the ride. An individual may be able to use the zone 2 power calculator to account for different factor that relate to an individual’s strength and power. For instance, zone 2 training may use a reference model for the power of an individual’s zone 2 training.
A common model is a functional threshold power test. Functional threshold power test are repeatable and many training software stores an individual’s functional threshold power. Another model is a critical power model.
Critical power models the relationship between an individual’s power and the length of time that they can maintain that power. Critical power may be higher then an individual’s functional threshold power. Lastly, an individual may use a lactate threshold test.
A lactate threshold test measures the amount of lactate that an individual produces during exercise. However, a lactate threshold test can be difficult for an individual to perform outside of a laboratory. The zone 2 power calculator can account for an individual’s choice of model.
Thus, the individual will not utilize the same percentage of power for each zone 2 training ride. In addition to the factors discussed above, another factor that the zone 2 power calculator may account for is the durability of an individual’s muscle. Durability is the ability of an individual to maintain the same power output over time without increasing their cardiac drift.
An individual that has high durability will be able to maintain a specified power output without increasing muscular fatigue. Therefore, an individual’s zone 2 power calculator can use the individual’s durability as a factor in determining the upper limit of the individual’s power for zone 2 training. An individual with low durability will be given a different target power than an individual with high durability.
Additionally, the zone 2 power calculator may account for an individual’s cadence and terrain. Cadence have an impact on the muscular effort of an individual. If an individual has a low cadence, their muscles must work harder to achieve those higher cadence rates.
This muscular effort increase their heart rate. Terrain impacts zone 2 efforts. For instance, if an individual is on an uphill terrain, the body must work to overcome the incline.
Therefore, an individual’s zone 2 power calculator may also apply corrections to the target power that is calculated for individuals that have low cadences or that ride on terrain other than flat terrain. There are additional benefit to utilizing the zone 2 power calculator over time. For instance, after an individual has performed a block of training within a season, or even after a few specific zone 2 training rides, an individual can update the zone 2 power calculator with their new functional threshold power measurements or cardiac drift measurements.
Because the individual’s strength and power has changed as a result of training, their zone 2 power calculator recommendations may change. For instance, the zone 2 power calculator may recommend a change in the upper limit of an individual’s power if an individual’s durability have improved. Thus, the zone 2 power calculator acts as a running check on an individual’s performance of zone 2 training.
Despite the benefits of the zone 2 power calculator, it does not account for all variables that may impact an individual’s ability to perform zone 2 training to target power levels. For instance, the zone 2 power calculator does not account for variables like sleep, nutrition, or stress. An individual’s body and power may be within the parameters of the zone 2 power calculator on one day, but their strength and energy may be less on another day due to lack of sleep or nutrition.
Thus, the zone 2 power calculator only provides an individual with a range of power target. The individual is encouraged to utilize the middle of that power range as their target power for zone 2 training. An individual should increase the target power to the upper limit of the zone 2 power calculator if they feel that they are able to perform zone 2 training at a higher rate of power; conversely, if they feel any difficulty in breathing or muscular fatigue, they should adjust to the lower portion of the power target that is provided by the zone 2 power calculator.
Finally, mastery of zone 2 training also use the body to determine whether the power calculations for zone 2 training are accurate. The numbers from the power calculator are a map of where the individual should direct their power. However, their body can provide information as to whether the power map is accurate.
If an individual feels strong with the power calculations but also experiences muscular fatigue, the map do not match the body. Conversely, if an individual feels that the power calculations are accurate to the body’s efforts, then the zone 2 training session was successful. If the two measurements do not match, the zone 2 power calculator has provided an individual with a means of adjusting their zone 2 training power before it becomes too intense for their body.