⚖️ BMI Calculator – European Standards
Calculate your Body Mass Index using metric or imperial units. Based on WHO & European health guidelines.
| Category | BMI Range | Health Risk | Common in Europe? | Recommended Action |
|---|---|---|---|---|
| Severe Underweight | < 16.0 | Very High | Rare | Consult a GP urgently |
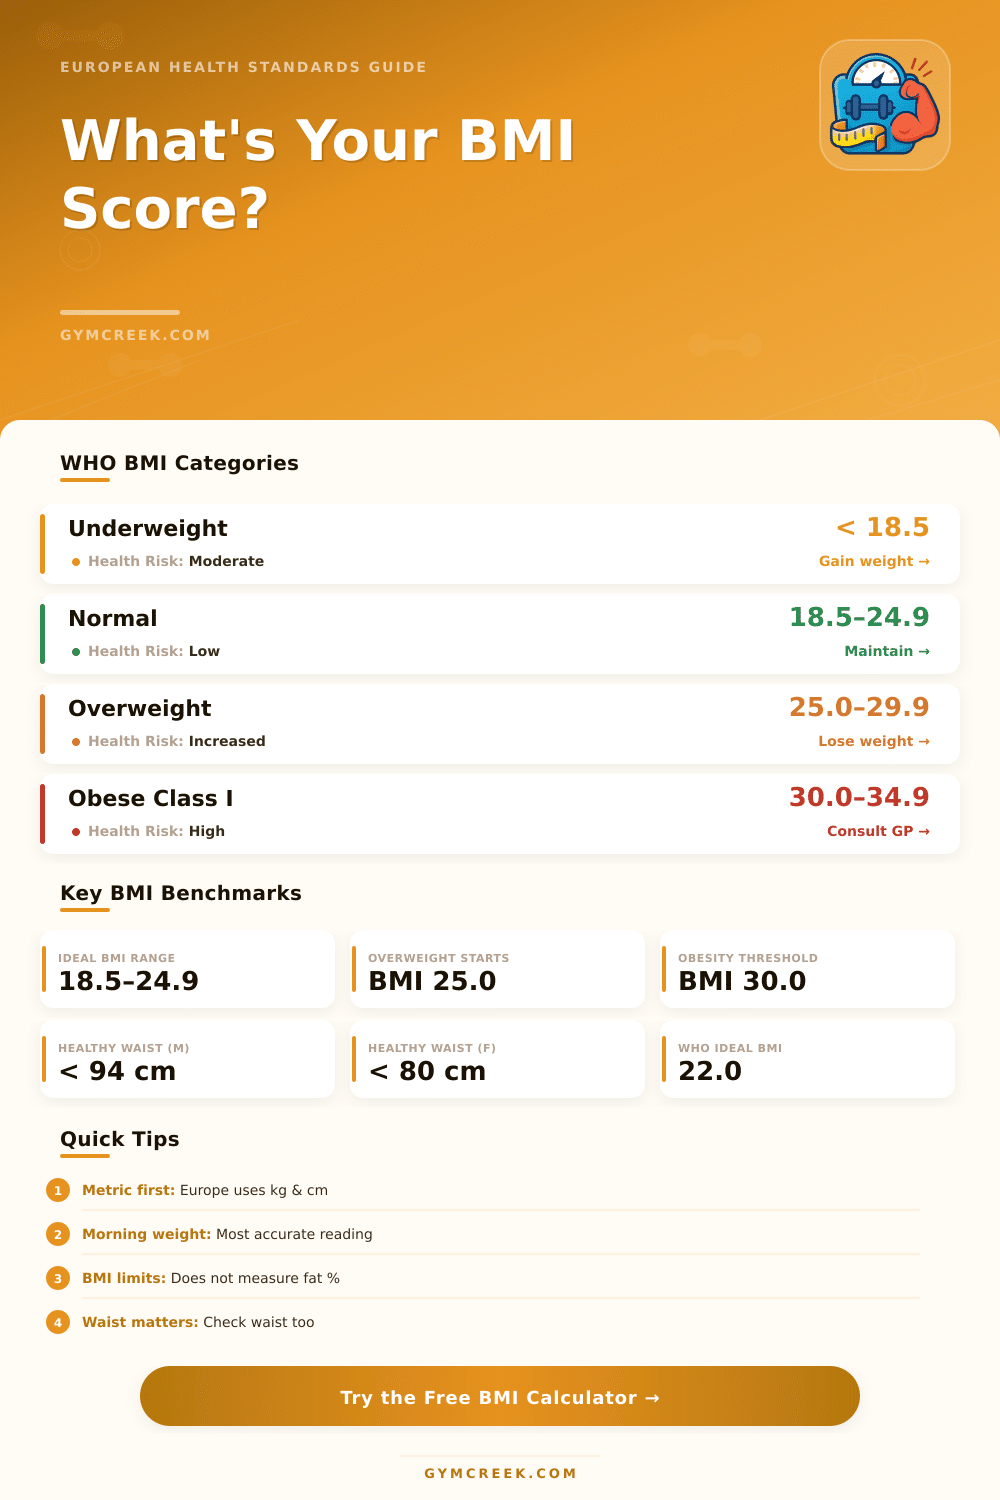
| Underweight | 16.0 – 18.4 | Moderate | ~3% adults | Increase caloric intake |
| Normal Weight | 18.5 – 24.9 | Low | ~35% adults | Maintain lifestyle |
| Overweight | 25.0 – 29.9 | Increased | ~36% adults | Moderate diet & exercise |
| Obese Class I | 30.0 – 34.9 | High | ~15% adults | GP consultation advised |
| Obese Class II | 35.0 – 39.9 | Very High | ~5% adults | Medical supervision |
| Obese Class III | ≥ 40.0 | Extremely High | ~2% adults | Specialist referral |
| Age Group | Avg BMI Men | Avg BMI Women | Healthy Range | Note |
|---|---|---|---|---|
| 18 – 24 | 23.5 | 22.8 | 18.5 – 24.9 | Peak metabolic rate |
| 25 – 34 | 25.1 | 24.3 | 18.5 – 24.9 | Lifestyle changes begin |
| 35 – 44 | 26.8 | 26.1 | 18.5 – 24.9 | Watch visceral fat |
| 45 – 54 | 27.6 | 27.4 | 18.5 – 24.9 | Hormonal shifts |
| 55 – 64 | 27.9 | 28.1 | 18.5 – 27.0 | Slightly higher OK |
| 65+ | 27.2 | 27.8 | 22.0 – 27.0 | Muscle mass priority |
| Risk Level | Men (Waist) | Women (Waist) | Health Implication |
|---|---|---|---|
| Low Risk | < 94 cm | < 80 cm | Healthy abdominal fat level |
| Increased Risk | 94 – 102 cm | 80 – 88 cm | Elevated cardiovascular risk |
| High Risk | > 102 cm | > 88 cm | Strongly associated with T2 diabetes |
| Height (cm) | Min Weight (kg) | Max Weight (kg) | Midpoint (kg) |
|---|---|---|---|
| 155 cm | 44.5 | 59.9 | 52.0 |
| 160 cm | 47.4 | 63.7 | 55.4 |
| 165 cm | 50.4 | 67.7 | 58.9 |
| 170 cm | 53.5 | 71.9 | 62.5 |
| 175 cm | 56.7 | 76.3 | 66.3 |
| 180 cm | 60.0 | 80.7 | 70.1 |
| 185 cm | 63.4 | 85.3 | 74.2 |
| 190 cm | 66.8 | 89.9 | 78.2 |
The Body Mass Index, or BMI for short combine your height with weight to create one simple number. This value tries to help you guess whether you have healthy weight overall. The formula itself is not entirely rough: you divide the weight in kilos by the square of height in metres, and get something in kg./m².
It was designed for use equally at adult men and women, as a way to check how much fat in the body some folk can have.
What BMI Is and What It Can Tell You
Groups of numbers appear in some guides about health. Under 18,5 is the zone of underweight. Between 18,5 and around 25 sits the normal, healthy area.
If it passes that, you enter the area of overweight. Obesity starts at 30, and it splits into three different grades in that range. For children and youngsters of 2 until 18 years the math adjusts, they conisder also age and sex besides the basic height and weight.
Here where the history of Body Mass Index becomes really interesting. In 1972, a scientist called Ancel Keys put out an article in the Journal of Chronic Diseases, that really put Body Mass Index on the map. His studies show that it beats other relations of weight to height for guessing the amount of body fat.
The whole movement for guessing fat in body grew, when obesity started too become an important problem in rich western nations.
On the other hand, Body Mass Index does not show the whole picture. It simply does not care about muscle mass, bone density or where the fat sits on your body. Athletes and bodybuilders commonly end up overweight or even obese according to the scale of Body Mass Index, although their real fat is very low, that is all because of the big amount of muscles, that changes the result.
On the other hand, older adults can have a perfectly average Body Mass Index, while they secretly carry too much fat because of loss of muscles over years. Pregnancy and nursing also mess up the whole thing, so Body Mass Index does not work for those times.
Here is another important reason to note: for African Americans, Body Mass Index commonly wrongly marks folks as overweight. Bigger values usually come from muscles instead of the extra fat, that really ties to obesity. The values can change by age and group, so the safest way to learn your real state is a checkup at the doctor.
The amount of body fat really guesses daily health better than Body Mass Index alone. The ratio of waist to height also wins support as a better marker, where something above 0,5 shows that too much fat tissue builds up. Even so, high Body Mass Index clearly ties to bigger risk of death in the wholepopulation, so it did not lose its value as a monitor.
It works well as a first step, simply not the only one that you should rely on.