2K Rowing Calculator
Estimate a 2000-meter rowing result from split pace, watts, recent intervals, body size, drag factor, stroke rate, pacing drift, and test-day readiness.
📌Rowing Presets
Presets load realistic rower profiles, pacing methods, stroke rates, drag settings, and split patterns, then recalculate the full 2k projection.
⚙Calculator
Estimated 2k time
Enter an erg profile to estimate time, split, watts, and pacing risk.
📊Fitness Metrics Grid
📑Reference Tables
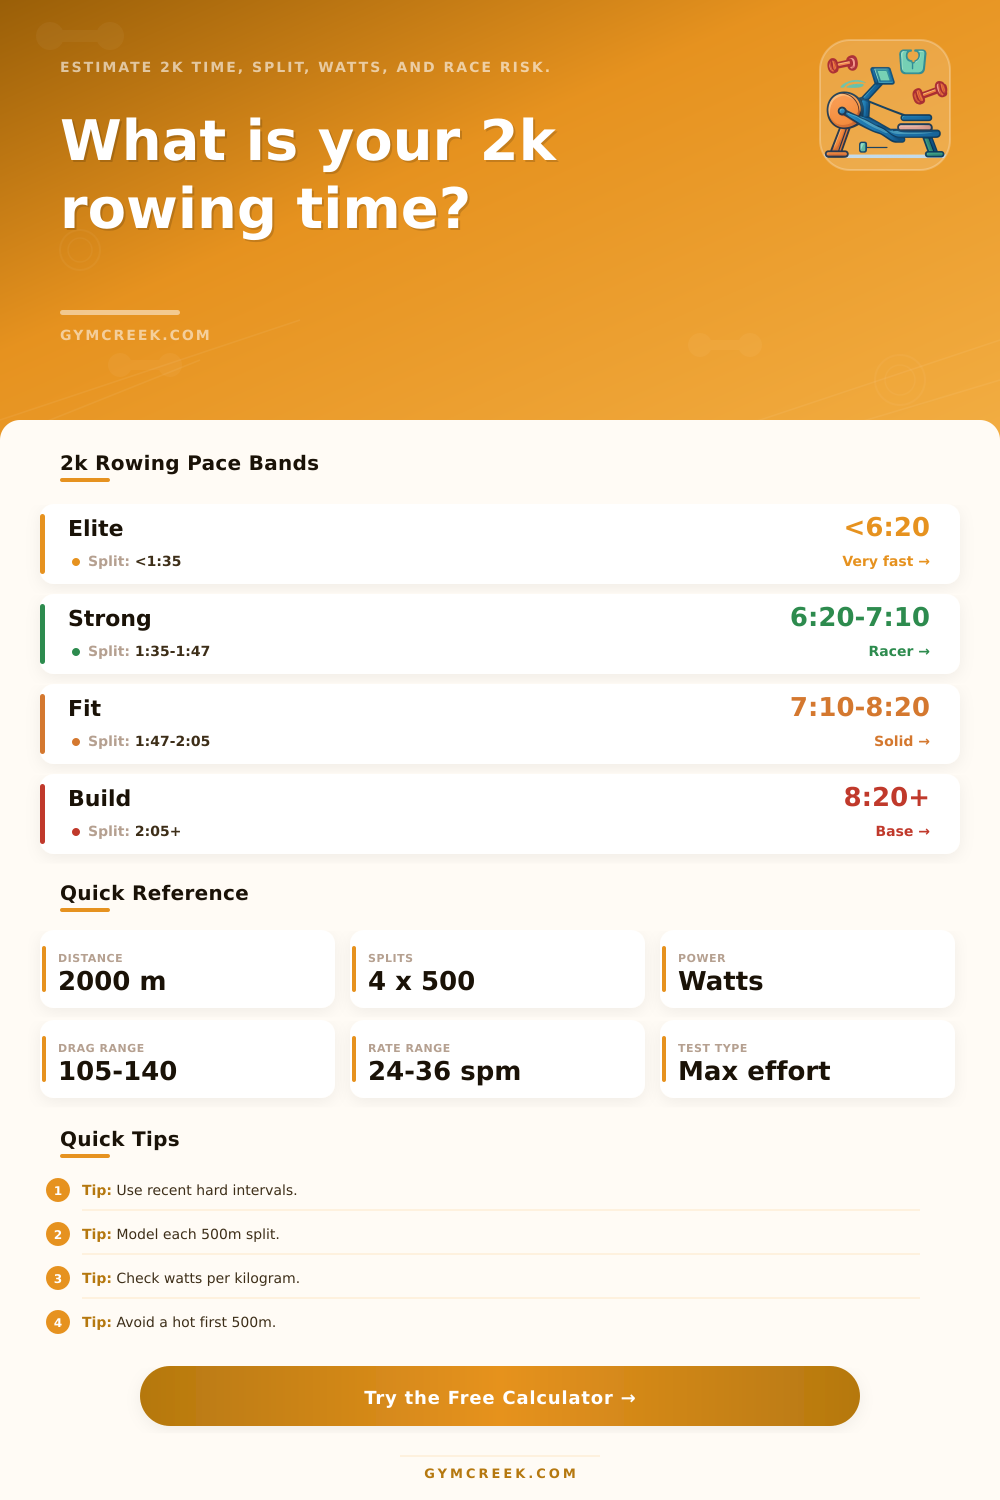
| 2k time | 500m split | Approx watts | Typical read |
|---|---|---|---|
| Under 6:20 | Under 1:35 | 359 W plus | Elite or high-level competitive power |
| 6:20 to 7:10 | 1:35 to 1:47.5 | 251 to 359 W | Strong trained rower or powerful athlete |
| 7:10 to 8:20 | 1:47.5 to 2:05 | 146 to 251 W | Solid general fitness and rowing base |
| 8:20 to 10:00 | 2:05 to 2:30 | 84 to 146 W | Developing rower or fitness benchmark |
| 10:00 plus | 2:30 plus | Under 84 W | Introductory pacing or recovery context |
| Plan | First 500m | Middle 1000m | Final 500m |
|---|---|---|---|
| Even split | Target pace | Target pace | Target pace or 1 sec faster |
| Negative split | 1 to 2 sec slower | Target pace | 2 to 4 sec faster |
| Fly and die | 3 sec plus faster | Rising lactate cost | High slowdown risk |
| Conservative | 2 sec slower | Build gradually | Strong sprint if spare capacity remains |
| Setting | Common range | What it changes | Calculator cue |
|---|---|---|---|
| Lower drag | 95 to 110 | More aerobic rhythm, lighter feel | Useful for smaller rowers or high rate |
| Moderate drag | 110 to 135 | Balanced force and rate | Typical 2k testing range for many athletes |
| High drag | 135 to 160 | More force per stroke, higher muscular cost | Add risk if rate or endurance is weak |
| Very high drag | 160 plus | Heavy pull and fast fatigue | Usually fragile for a maximal 2k |
| Formula | Inputs used | Output | When to use |
|---|---|---|---|
| Concept2 watts | 500m split | Power estimate | Converts pace to watts with 2.8 / pace cubed |
| Watts to split | Average watts | 500m pace | Builds a 2k time from power target |
| Interval model | Distance, repeats, rest | 2k projection | Penalizes short rested pieces |
| Mifflin-St Jeor | Sex, age, height, mass | BMR context | Energy context only, not performance scoring |
| Risk score | Drift, rate, drag, readiness | Low to very high | Flags fragile pacing assumptions |
💡Practical Notes
The 2k test is used in rowing training because the 2k test is long enough to reveal any weakness in the fitness of a person and short enough to require a highly intensity of effort from that person. A person utilizes the 2k test to measure there pacing, there fitness, and there mindset. Their mindset will show through in how they manage there energy for the four 500 meter segments, and the test will measure their fitness in how well they maintain there power despite the fatigue that develops in their bodies during the 2k test.
Additionally, the 2k test will show if an athlete has been training with the same level of effort as they will exhibit during the test. To utilize this calculator, several inputs is required to reveal how well a person rows. One of the inputs that must be used is the stroke rate, which informs the calculator at what rate the person turns the flywheel.
How the 2k Test Works
The drag factor is another input that informs the calculator of the resistance that the rowing machine creates. Additionally, the calculator will measure the person’s readiness on a scale from one to ten. This will inform the calculator of the level of fatigue that the body feel, as a more tired body will be able to produce fewer watts than a rested body.
Pacing drift is one of the variable that will impact the results that are presented from the calculator. Pacing drift occurs when a person rows the last 500 meters at a slower rate than there first 500 meters. The calculator increases the risk score for a rower if this variable are entered.
The split that is recorded during the third 500 meters will be a critical piece of information to determine if the test will be executed in a controlled manner or in a desperate attempt to complete each segment. The calculator will provide a measurement of the watts per kilogram that an athlete can produce. The absolute amount of power that a rower produces is only part of the story.
An additional measurement of watts per kilogram allow for a comparison between rowers of different body size. An athlete that can produce higher watts with less body mass is stronger in terms of power. Reference tables will be provided on the calculators page to allow the person to place there results into a range of results from other rower.
These tables will help to show how fast or slow an athlete is in comparison to others. These tables will prevent a person from feeling that there result from a single 2k test is either a total success or failure. Many rowers find that there abilities gradually improves, rather than in even steps.
Thus, these tables will allow a person to better understand there abilities relative to others. The interval model uses an individual’s recent training pieces to model the potential outcome of a 2k test. The interval model takes into consideration the distance for each training piece, the amount of rest between each training piece, and the number of training pieces performed by that individual.
For instance, performing four 1000 meter distances with three minutes of rest between each distance will have a different result than six 500 meter distances with ninety seconds of rest between each distance. Additionally, short distances with rest allow for athletes to exhibit faster average paces for each training piece. However, these faster average paces do not always translate to an even pace for 2000 meters on an ergometer.
Therefore, the penalty for such an outcome is include in the interval model. Another set of inputs uses the size of the individual to determine there total energy. The body size inputs will allow for the calculator to determine an athlete’s basal metabolic rate and how many kilocalorie that they expend each day.
The calculator estimates these values so that the energy cost of the 2k test can be compared to the nutrition levels that are used during training. This comparison ensures that the athlete is fueling there body properly so that they are not too heavy or depleted of there energy at the start of the test. Many rowers make mistakes when using the 2k test.
Many rowers may too often focus upon the first 500 meters of the test, as they tend to be the fastest 500 meters of the race. Rowers may sacrifice there strength during the last 500 meters of the race in order to exhibit speed during the first 500 meters. Rowers also tend to under-rate the importance of there drag factor, as they may not be accustomed to the resistance that the ergometer will exhibit.
Additionally, some rowers may ignore there level of recent training with the body and may instead exhibit fatigue during there 2k test. The pacing-shape table will display a row’s potential for each of the 500 meter segments. For each segment, a rower can plan to even split each segment to maintain there strength for each 500 meter portion of the 2k test.
A negative-split portion of the race will have the rower start at a slower pace but exhibit speed during the last 500 meters. A “fly-and-die” portion of the race will exhibit an athlete racing the first 500 meters at a very fast rate with the athlete struggling during the last 500 meters. The risk score will provide a number to the athlete based on the variables that is entered into the calculator.
The risk score will combine the risk of pacing drift, spread of splits, drag factor, stroke rate, and readiness to determine a risk score for each athlete. This risk score will not guarantee the outcome of an athlete’s 2k test, but any high risk score indicate that there are variables that could affect the outcome of the test. Thus, this risk score can provide information to an athlete prior to the test as to how to adjust there variable.
While the calculator cannot provide the experience of rowing on the ergometer, the calculator does provide information for a person prior to beginning there 2k test on the ergometer. If the modeled splits, power ratio, and risk score match the athlete’s recent training on the ergometer, the athlete should execute the modeled splits. However, if those three factors does not match the athlete’s recent training on the ergometer, the athlete should adjust at least one of those variables.
Thus, this tool makes the information provided by the calculator easier to read by the athlete and allows that athlete to treat a 2k test as information to be process by the athlete.